



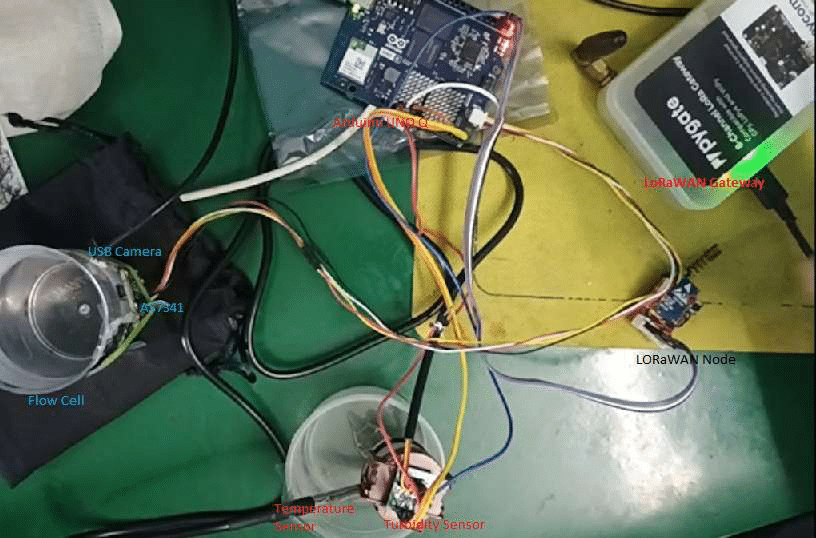
AquaWatch: Edge-AI and LoRaWAN-Based Water Quality Monitoring System for Rural India is an autonomous, low-cost early-warning solution designed to detect abnormal drinking-water quality conditions in rural water distribution networks, municipal pipelines, and storage facilities. The system integrates the Arduino UNO Q’s STM32U585 microcontroller and Qualcomm QRB2210 application processor to enable low-power sensor acquisition, image processing, and on-device AI inference. It combines three complementary monitoring approaches: computer vision using a USB micro-inspection camera and OpenCV, physical sensing using an ASAIR AZDM01 turbidity sensor and DS18B20 temperature sensor, and multispectral analysis using the AS7341 spectral sensor. The collected data is processed through a Python-based multimodal fusion pipeline to evaluate water-quality indicators, cross-check abnormal readings, and classify the observed condition as Safe, Warning, or Critical. LoRaWAN enables long-range transmission of alerts to a central monitoring station without requiring cellular connectivity at each monitoring node. Local MicroSD storage maintains sensor records and selected images for subsequent inspection and analysis. The modular architecture also supports future integration of pH, oxidation-reduction potential (ORP), and conductivity/TDS sensors. By combining physical measurements, optical analysis, computer vision, and edge intelligence, AquaWatch aims to improve contamination-event awareness, reduce false alarms caused by individual sensor anomalies, and support scalable drinking-water monitoring across rural India. The system is intended as an early-warning tool and does not replace laboratory testing or certified microbiological analysis for confirming drinking-water safety.
Component List:
| ID | Name | Designator | Quantity |
| 1 | Arduino UNO Q | BOARD | 1 |
| 4 | ASAIR AZDM01 Photoelectric Turbidity Sensor | SEN1 | 1 |
| 5 | Dallas DS18B20 Stainless Waterproof Temperature Sensor | SEN2 | 1 |
| 6 | AMS / Adafruit AS7341 10-Channel VIS/NIR Optical Spectrometer | SEN3 | 1 |
| 7 | USB camera(Psoc Edge E84 AI Kit camera) | CAM1 | 1 |
| 8 | Ebyte E78-900M22S LoRaWAN Transceiver | LoRa | 1 |
| 9 | 4.7kΩ Resistor (DS18B20 1-Wire Pull-Up to 3.3V) | RES1 | 1 |
| 10 | 10kΩ / 30kΩ resistor | RES2 /RES3 | 3 |
| 11 | USB Hub | Hub | 1 |
| 12 | 5V 2A DC Adapter | PWR | 1 |
Project Explanation Step By Step
Across rural India, the Jal Jeevan Mission has expanded piped-water access to millions of households. However, drinking-water safety remains vulnerable to sewage ingress caused by leaking, damaged, or poorly separated water and sewerage pipelines, particularly during monsoons and periods of intermittent supply.
The recent Bhagirathpura incident in Indore demonstrates how rapidly such contamination can become a public-health emergency. In late 2025, sewage entered a drinking-water pipeline, causing a major diarrhoeal outbreak and multiple deaths; subsequent investigations confirmed bacterial and faecal contamination.
Traditional monitoring based on periodic sampling and laboratory testing can leave a critical gap between contamination occurring and its detection. What is urgently needed is an autonomous, low-cost sentinel node capable of continuously monitoring water-quality indicators at municipal pipelines and storage points, detecting abnormal contamination signatures in near real time, and transmitting alerts over long-range networks such as LoRaWAN—without relying on cellular internet which needs monthly recharge and recurring cost.
AquaWatch tries to addresses the problem of early drinking-water contamination detection through a three-pillar multimodal architecture: physical sensing, spectral analysis, and computer vision. Rather than relying solely on environmental sensor which is prone to false readings caused by sensor fouling or sediment deposition. AquaWatch combines independent sensing modalities to improve reliability and reduce false alarms.
The system exploits the heterogeneous architecture of the Arduino Uno Q, combining the ultra-low-power STM32U585 microcontroller for deterministic sensor acquisition with the high-performance Qualcomm QRB2210 application processor running Debian Linux for image processing, multimodal data fusion, and AI inference.
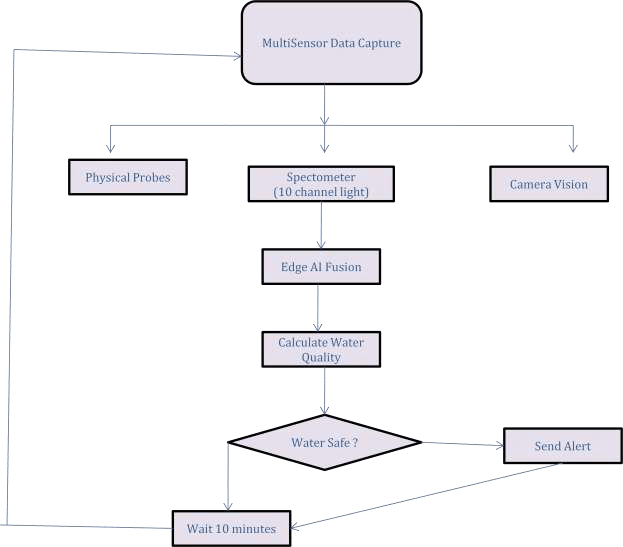
The STM32U585 operates as the autonomous sensing controller. At a configurable interval—10 minutes in the current prototype—it activates the calibrated high-CRI white LED for the AS7341, acquires its optical channels over I²C, samples the ASAIR AZDM01 photoelectric turbidity sensor, and reads the DS18B20 digital temperature sensor over 1-Wire. The resulting telemetry is transferred to the QRB2210 core through the Arduino inter-core Bridge/RPC interface for camera image capture and overall data fusion and inference.
Pillar 1— Computer Vision / Visual Inspection
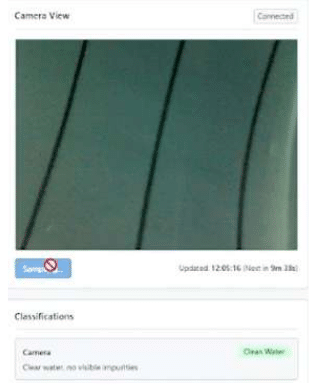
A USB micro-inspection camera observes the water through a transparent flow cell. A contrast grid attached on opposite wall provides a controlled visual reference for quantitative image analysis. The OpenCV pipeline evaluates image sharpness using Laplacian variance, together with colour and saturation statistics.
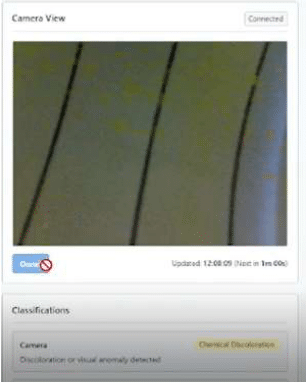
Clear water preserves the fine structure of the grid lines, whereas suspended particles, colloidal material, biological growth, or flocs scatter light and reduce image sharpness. Colour-space analysis identifies abnormal chromatic changes, while saturation variations can provide additional evidence of surface films or other visible anomalies.
Pillar 2 — Physical Water Sensing
The ASAIR AZDM01 provides a quantitative optical turbidity measurement using approximately 940-nm infrared transmission through the water sample, while the DS18B20 provides temperature for environmental context and measurement adjustments.
The architecture also provides provision for additional pH, ORP, and TDS/conductivity sensors. These sensors are not connected in the current prototype, but expansion interfaces have been incorporated and disabled in Config,so they can be added in future versions.
Pillar 3 — Multi-Spectral Analysis
The AS7341 captures multiple optical channels across approximately 415–680 nm, allowing AquaWatch to monitor changes in the water’s spectral signature.
Spectral features and normalised indices can be extracted to characterise changes associated with dissolved organic material, suspended matter, algal signatures, and other optical anomalies. Spectral analysis provides a broader optical fingerprint of the sample and can therefore serve as an independent cross-check against physical-sensor measurements.
The three pillars are fused through the Python code running on the Linux core and a water quality score is computed; water quality is classified into operational states such as Safe, Warning, or Critical.
LoRaWAN technology is used as the transport medium to send the alert to a central observatory located kilometres away; a single LoRaWAN Gateway can serve hundreds and thousands of nodes I range, so a central monitoring station can cater to multiple villages and towns.
Sensor data and selected high-resolution optical frames can also be stored locally on MicroSD, providing an audit record incase required for analysis.
AquaWatch therefore goes beyond a conventional water-quality meter: physical sensors measure, spectral analysis, computer vision observation, and multimodal fusion cross-validation —creating a more resilient autonomous early-warning system for drinking-water contamination.
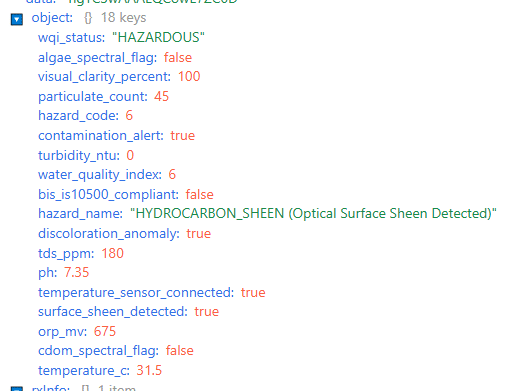
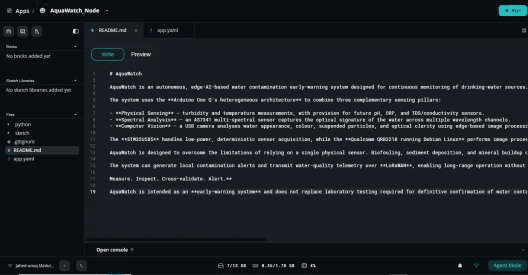
Coding Explanation and Configuration
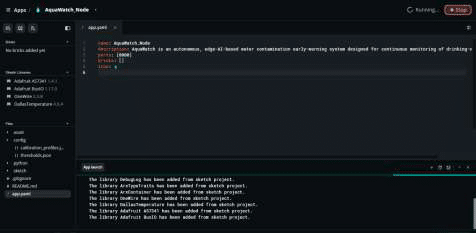
Connect the Arduino UNO Q to the computer through USB or over Network Mode, Open Arduino AppLab IDE.
Create a New Project.
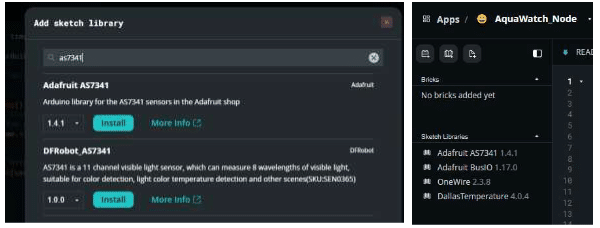
Add the required sketch Libraries
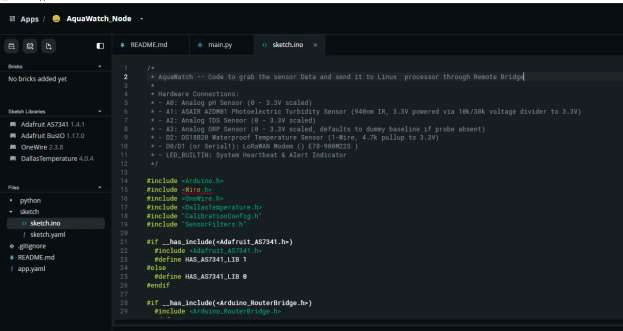
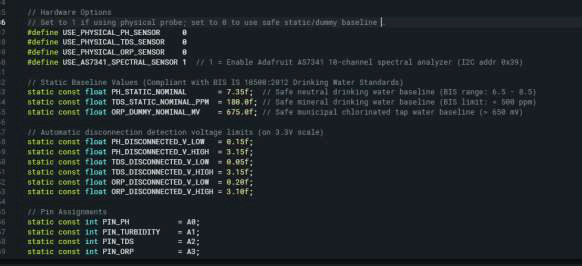
Config and baseline: change the value to 1 when the Physical sensors are connected.
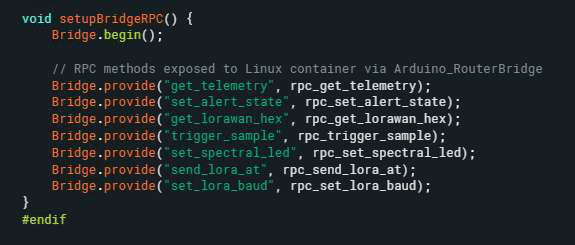
Setup the Bridge and declare the API’s
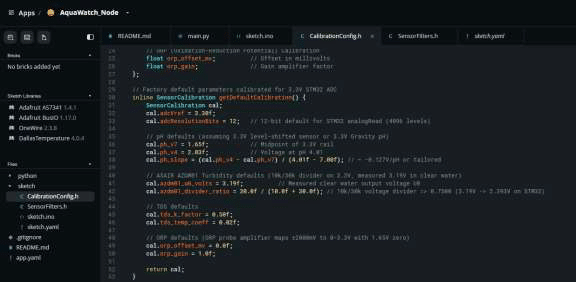
CalibrationConfig.h header file contains the calibration values
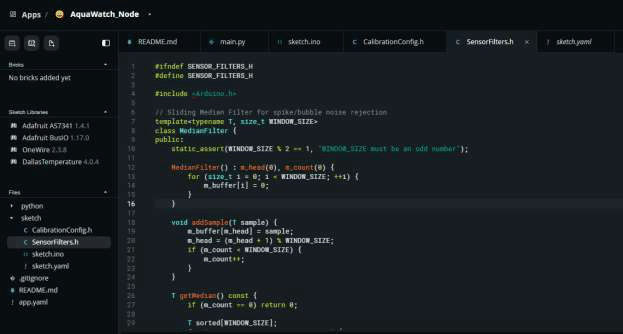
sensorFilters.h contains the helper function to app for the different filters applied to the sensor measurement
The measurements are taken
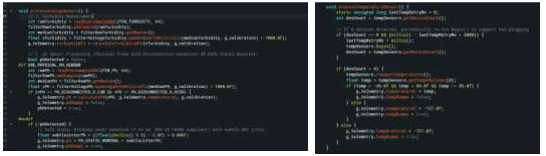
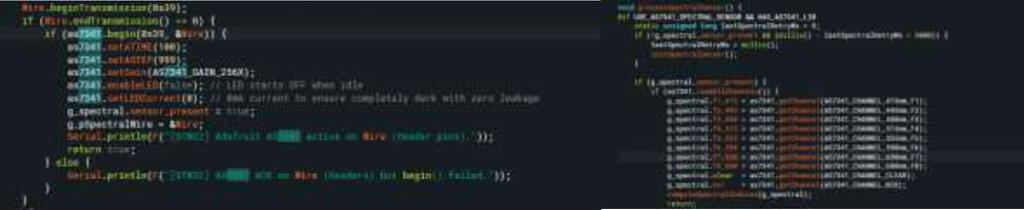
Spectral measurement is taken
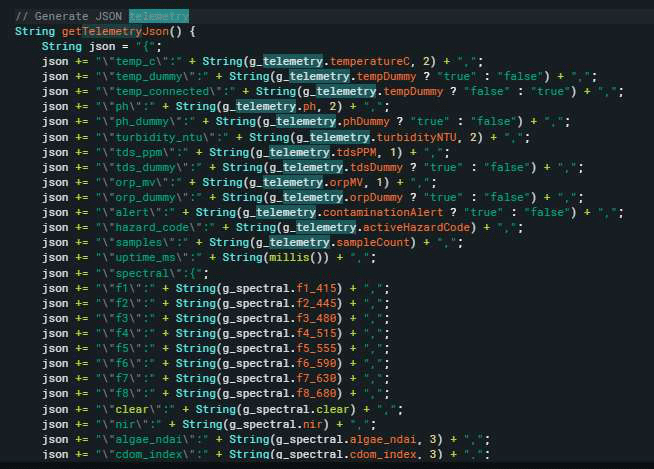
Telemetry data model is built
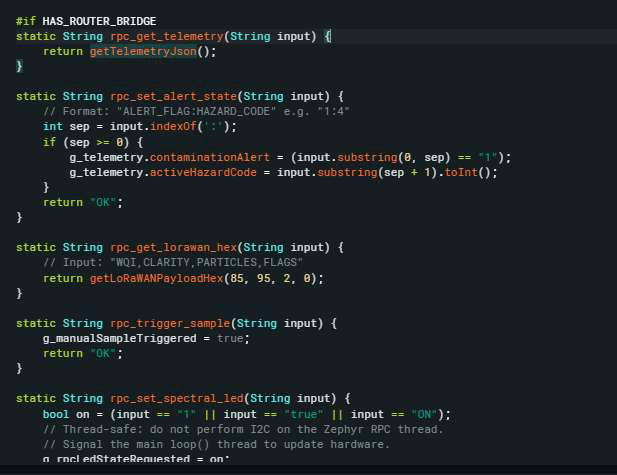
The RPC API’s are built
Next comes the Python part for the Linux Debian Core.
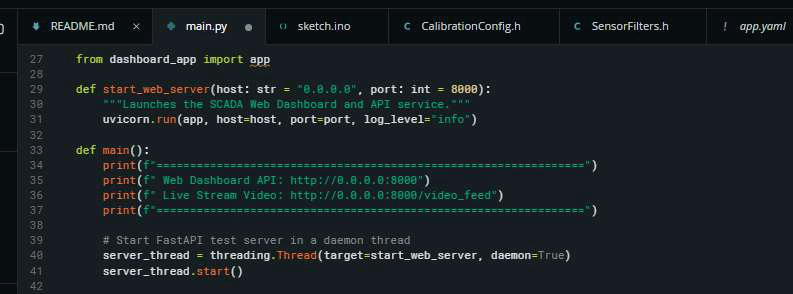
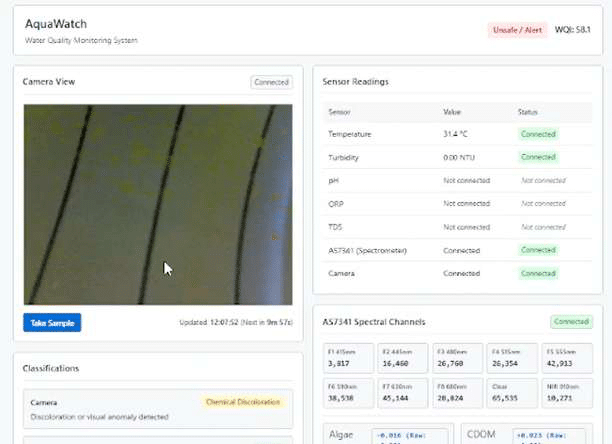
Main.py, starts the web server, this is only for diagnostic purposes and will be optional and config-driven on the prod release.
Below are the various Python files and their high-level functions
| main.py | Application Entry Point | Launches Uvicorn ASGI server hosting dashboard_app:app on port 8000. |
| dashboard_app.py | FastAPI Application & Orchestrator | Runs background 10-minute scheduler, coordinates the sampling cycle, and hosts REST/streaming endpoints. |
| bridge_client.py | BridgeClient | Communicates with the STM32U585 MCU via Arduino_RouterBridge RPC or serial fallback. |
| vision_inspector.py | WaterVisionInspector | Executes OpenCV camera inspection: adaptive clarity, CIE-Lab ΔEΔE, particle counting, and surface sheen. |
| vision_ai_classifier.py | VisionAIClassifier | Extracts 6D visual embeddings and runs one-shot prototype exemplar classification with RBF boosting. |
| sensor_anomaly_model.py | SensorAnomalyModel | Computes 10-D asymmetric Mahalanobis distance, continuous sigmoid threat probability, and probe drift detection. |
| contamination_engine.py | ContaminationEngine | Fuses physical, optical, and vision signals; computes BIS IS 10500 WQI; executes 8 municipal hazard diagnostic rules. |
| calibration_manager.py | CalibrationManager | Manages one-shot exemplar prototypes and baseline zero-point calibrations stored in calibration_profiles.json. |
| lorawan_service.py | LoRaWANService | Serial AT command driver for Ebyte E78 modem; serializes and transmits 15-byte packed binary telemetry. |
| sdcard_manager.py | SDCardManager | Writes structured CSV telemetry rows locally to flash/microSD storage for offline historical record-keeping. |
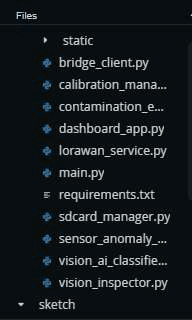
The asset folder contains the complete frontend web application and dashboard interface for AquaWatch:
The config folder contains the configurations
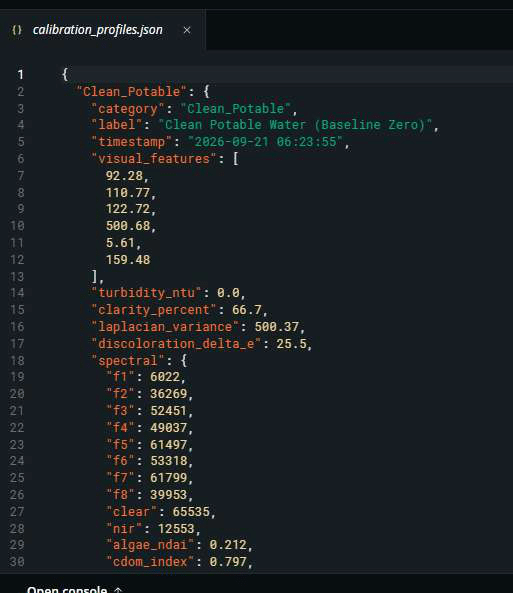
The calibration calibration_profiles.json is read at boot to get the values , also when the user trains the system, the new baseline values are written to this json file and stored.
Connection Explanation
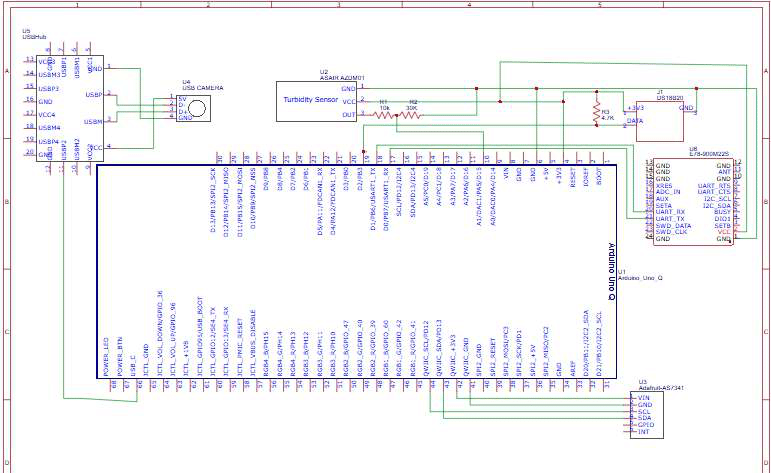
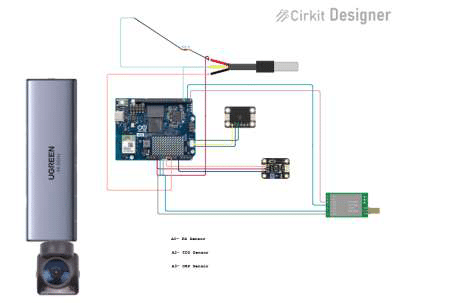
The ASAIR AZDM01 turbidity sensor connects to analog pin A1 through a 10 kΩ/20 kΩ10 kΩ/20 kΩ voltage divider, safely stepping its 5V output down to the 3.3V ADC limit.
The DS18B20 temperature probe connects to digital pin D2 with a 4.7 kΩ4.7 kΩ pull-up resistor.
An Adafruit AS7341 spectrometer communicates over I2C (SDA/SCL), while optional pH, TDS, and ORP boards wire to pins A0, A2, and A3. The UVC camera connects directly to the Linux USB-Host port, and an Ebyte LoRaWAN modem uses UART (D0/D1) pins. The connection diagram is as below.
Testing
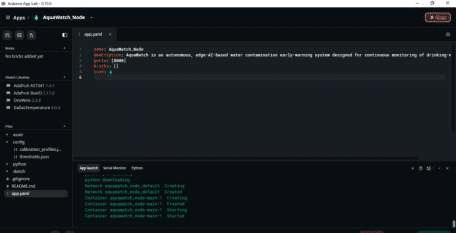
Start the application on Arduino AppLab
Open the dashboard.
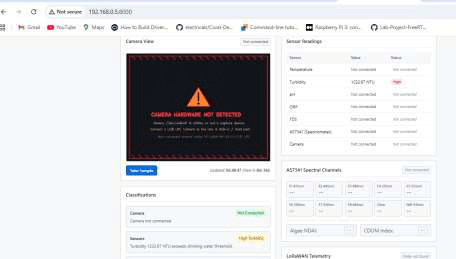
If the camera is not appearing, then change the USB mode to host mode.
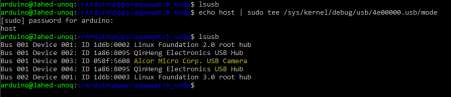
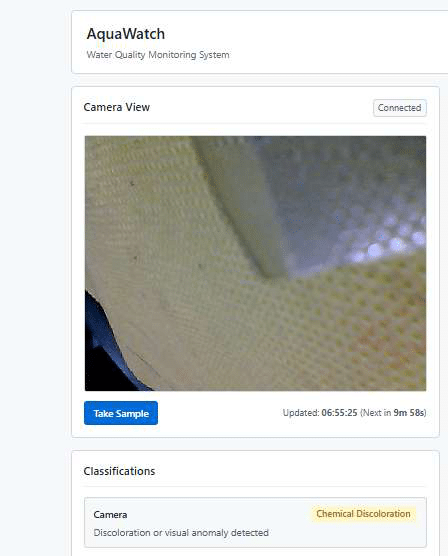
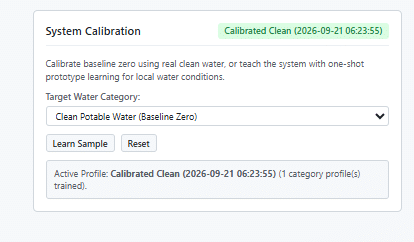
Connect all the sensors and test the reading; calibrate with pure water from the water purifier to set the baseline if required.
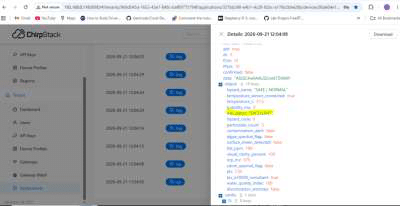
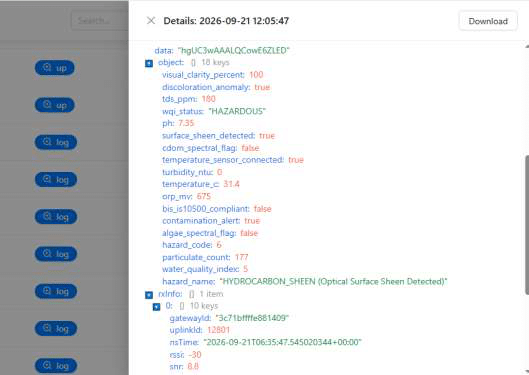
Take a sample and send the uplink; the data should be visible on ChirpStack LoRaWAN.
I tested with organic waste and chemical dyes, and it worked correctly.
Schematics