



Mass public gatherings — religious festivals, election rallies, political campaigns — are a recurring feature of Indian public life, and a recurring source of preventable tragedy. Stampedes and crowd-crush events typically develop from localized precursors — a sudden surge in density, erratic or reversed movement at a chokepoint, rising acoustic panic — that are invisible to manual observation until the situation has already become dangerous. Existing crowd-safety infrastructure is largely reactive: CCTV reviewed after the fact, or simple sensor deployments that stream raw data to a cloud backend for analysis. This dependency is a critical design flaw, since venue networks are typically the first infrastructure to saturate or fail under the exact crowd load that makes monitoring most urgent.
CrowdPulse addresses this with a mesh of low-cost, battery-powered edge sensor nodes, each built around an Arduino UNO Q, deployed at fixed points across a gathering space. Each node independently senses three physical correlates of crowd risk: movement and density, via a Waveshare S3KM1110-based 24GHz mmWave radar sensor over UART, capturing presence, distance, and micro-motion without requiring line-of-sight or lighting; environmental discomfort, via a BMP280 (temperature and barometric pressure, I2C) and DHT22 (humidity, single-wire), both established contributors to crowd agitation and physiological stress; and acoustic anomalies, via a USB microphone connected through the board’s USB-C host mode, distinguishing sudden panic-associated sound bursts from steady ambient crowd noise.
These signals are fused locally into a per-node stress score by the Uno Q’s real-time STM32U585 co-processor, which handles deterministic, timestamp-synchronized sampling across the UART, I2C, and single-wire sensor interfaces — a design necessity, since stampede precursors are defined by rate of change across sensors rather than any single instantaneous reading, and sampling jitter would corrupt exactly the signal the system depends on.
Nodes exchange stress scores over a LoRa mesh (SX1278, SPI), chosen specifically for its independence from venue Wi-Fi and cellular infrastructure — the network layer most likely to be degraded at the moment monitoring matters most. On the Qualcomm QRB2210 Linux side, a quantized, lightweight anomaly-detection model runs inference across the fused multi-node data stream, identifying cross-node correlation patterns: a localized disturbance at one node — a movement surge, an acoustic spike — that predicts cascading risk before it is independently visible at neighboring nodes. This correlation layer, rather than any single sensor threshold, is the system’s core technical contribution, and is what distinguishes CrowdPulse from existing single-node crowd counters or decibel-alarm systems documented elsewhere.
When correlated risk crosses a defined threshold, affected nodes trigger local alerts and flag the at-risk zone for event organizers — with the entire detection pipeline, from raw sensor sampling to anomaly inference to mesh alerting, computed at the edge and requiring no external connectivity.
The Uno Q’s dual-processor architecture is the specific enabling factor for this design: the STM32U585 provides the deterministic multi-protocol sensor sampling (UART, I2C, single-wire) that real-time fusion requires, while the QRB2210 provides USB host support for live audio and sufficient compute for on-device model inference — capabilities that would otherwise require either splitting the system across two separate boards or offloading inference to a cloud service, undermining the project’s core no-connectivity design goal.
Component List:
| ID | Name | Designator | Quantity |
| 1 | Arduino UNO / Arduino Q | U! | 1 |
| 2 | BMP280 module | Mod_1 | 1 |
| 3 | DTH22 module | Mod_2 | 1 |
| 4 | S3KM1110 based mmWave radar | Mod_3 | 1 |
| 5 | SX1278 Lora module | Mod_4 | 1 |
Project Explanation:
The design features an Arduino UNO Q-based intelligent crowd monitoring system that combines environmental sensing, mmWave radar-based crowd detection, LoRa wireless communication, edge-based machine learning, audio analysis, and a web-based monitoring dashboard. Unlike conventional crowd monitoring systems that depend mainly on manual observation or individual sensors, this system integrates multiple sensing and processing methods into a single platform for continuous monitoring and detection of unusual conditions.
The monitoring nodes use a DHT22 temperature and humidity sensor, BMP280 temperature and pressure sensor, and an S3KM1110 24 GHz mmWave radar to continuously collect information about the surrounding environment and crowd conditions. The mmWave radar is used to obtain crowd-density-related information, while the environmental sensors provide additional information about the conditions at each monitoring location.
Multiple monitoring nodes can communicate with each other using LoRa wireless communication. Each node maintains information about the other nodes and shares updated sensor data across the network. This allows the system to monitor multiple locations and maintain a distributed view of the monitored area rather than depending on a single sensing node.
The Arduino UNO Q provides both microcontroller and Linux-based computing capabilities. The microcontroller side is responsible for sensor acquisition, mmWave radar communication, and LoRa-based data exchange. The collected information is then transferred to the Linux side of the UNO Q through the RouterBridge interface, where higher-level processing and machine-learning operations are performed.
On the Linux side, the system uses an Isolation Forest anomaly detection model to analyze environmental sensor data and identify unusual conditions. In parallel, audio captured through a microphone is analyzed using the YAMNet TensorFlow Lite model to identify potentially significant sounds. The environmental and acoustic results are combined to generate a fused event score, allowing the system to identify potentially abnormal situations using multiple sources of information.
Finally, the processed information is presented through a Flask-based web dashboard. The webpage provides a centralized view of the connected monitoring nodes, sensor readings, crowd-related information, anomaly status, and detected events. This enables the user to observe the monitored environment in real time and provides an interactive interface for analyzing the information collected by the distributed sensor network.
Coding Explanation and Configuration:
First, the Arduino IDE is used to program and flash the sketch.ino firmware onto the Arduino UNO Q. The required Arduino libraries are installed through the Library Manager in the Arduino IDE by navigating to Sketch → Include Library → Manage Libraries, searching for the required library, and selecting Install.
The main libraries used in the Arduino firmware include the Adafruit BMP280 library for interfacing with the BMP280 sensor, the DHT sensor library and DHT Unified Sensor library for the DHT22, the LoRa library for wireless communication, and the Arduino RouterBridge library for communication between the MCU and Linux sides of the UNO Q. Standard libraries such as Wire.h and SPI.h are also used for the required communication interfaces.
After installing the libraries, the sketch.ino file is opened in the Arduino IDE, the Arduino UNO Q is selected as the target board, and the firmware is compiled and uploaded to the board.
During initialization, the program configures the connected sensors and communication interfaces. The BMP280 is initialized using the Adafruit BMP280 library, while the DHT22 is configured using the DHT library. The LoRa module is initialized with its configured communication pins and frequency for communication between the monitoring nodes.
The S3KM1110 mmWave radar does not require a separate library in this project. It is directly connected to the UNO Q through Serial1. The firmware communicates with the radar using its UART protocol, sends the required configuration commands, receives the binary data frames, and extracts the required crowd-density information from the received data.
The firmware continuously reads the sensor values and stores them in the node data structure. The collected information includes temperature, humidity, atmospheric pressure, and radar density. Each monitoring node is assigned a unique node ID, allowing multiple nodes to operate together within the LoRa network.
The LoRa communication section periodically exchanges node information between the monitoring nodes. Received data is compared with the locally stored information using the version number, allowing newer data to replace outdated information. The updated network state is then transferred from the MCU side to the Linux side of the UNO Q using the Arduino RouterBridge interface.
Python Environment Configuration
The Python processing section runs directly in the Linux terminal of the Arduino UNO Q. Before running the Python application, the required Python packages must be installed on the UNO Q.
The terminal can be opened and the required packages can be installed using pip. The main Python dependencies used by the project include Flask for the web server and dashboard API, NumPy for numerical processing, Pandas for handling sensor data, Scikit-learn for the Isolation Forest anomaly detection model, Joblib for loading the trained machine-learning model and scaler, OpenCV for media processing, and TensorFlow Lite Runtime for running the YAMNet audio classification model.
The packages can be installed from the UNO Q terminal using:
pip install flask numpy pandas scikit-learn joblib opencv-pythonFor running the YAMNet TensorFlow Lite model, the TensorFlow Lite runtime can be installed using:
pip install tflite-runtimeThe Python application also uses the trained model files included with the project. The Isolation Forest model, its corresponding scaler, and the YAMNet TensorFlow Lite model are loaded by the Python program at runtime, so these files must remain in their expected project directories.
Once the required packages and model files are available, the Python application can be started from the UNO Q terminal by running the project’s Python entry point, for example:
python3 main.py
The Python application then receives the sensor/network data from the MCU side through the RouterBridge interface, performs environmental anomaly detection, processes microphone audio using YAMNet, calculates the combined event score, and starts the Flask web server for the monitoring dashboard.
Thus, the complete software configuration consists of Arduino libraries installed through Arduino IDE for the MCU firmware, followed by Python packages installed through the UNO Q Linux terminal for machine-learning, audio processing, and web-dashboard operation.
Connection Explanation:
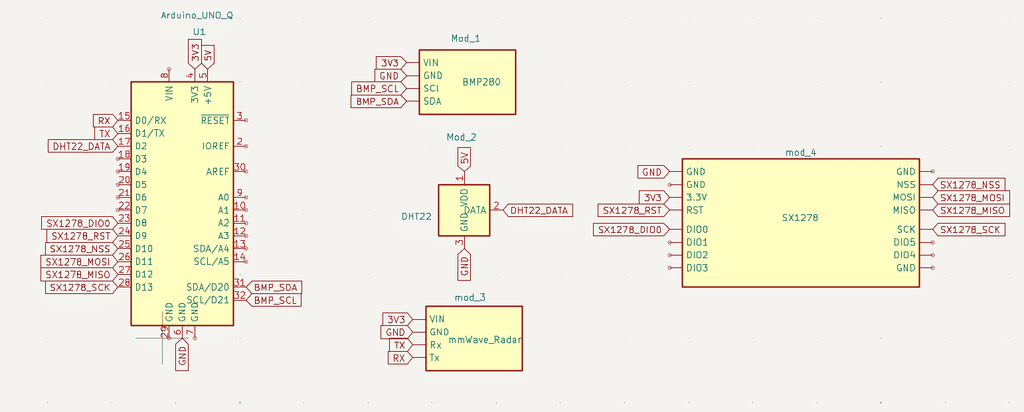
The hardware connections are made between the Arduino UNO Q and the different sensing and communication modules. The UNO Q acts as the central controller for collecting sensor data and communicating with the other monitoring nodes.
BMP280:
The BMP280 is connected to the UNO Q using the I²C interface
| BMP280 Pin | Arduino UNO Q |
| VCC | 3.3V |
| GND | GND |
| SDA | D20 / SDA |
| SCL | D21 / SCL |
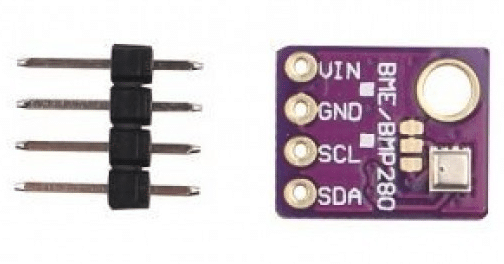
The BMP280 measures temperature and atmospheric pressure.
DHT22:
The DHT22 is connected as follows:
| DHT22 Pin | Arduino UNO Q |
| VCC | 3.3V |
| GND | GND |
| DATA | D2 |
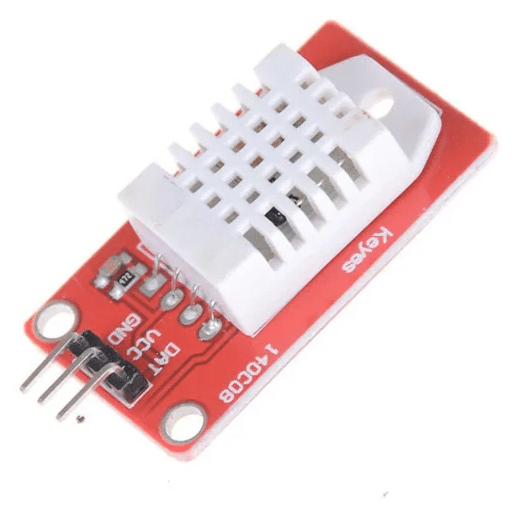
The DHT22 provides temperature and relative humidity measurements.
S3KM1110 mmWave Radar:
The S3KM1110 mmWave radar communicates with the UNO Q through a UART interface. No separate Arduino library is required for the radar; the firmware communicates directly with the module using its UART protocol.
| mmWave Pin | Arduino UNO Q |
| VCC | 5V / 3.3V depending on module |
| GND | GND |
| TX | D0 / RX |
| RX | D1 / TX |
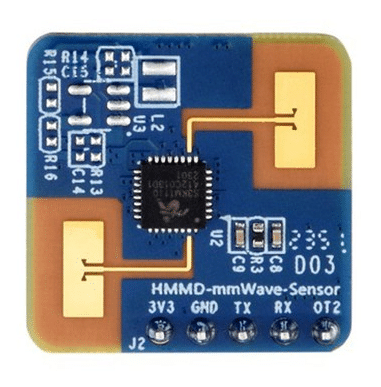
The radar provides information used to determine crowd presence and density.
LoRa SX1278:
The SX1278 LoRa module is connected using the SPI interface along with dedicated control pins:
| SX1278 Pin | Arduino UNO Q |
| VCC | 3.3V |
| GND | GND |
| SCK | D13 / SCK |
| MISO | D12 / MISO |
| MOSI | D11 / MOSI |
| NSS / CS | D10 / SS |
| RESET | D9 |
| DIO0 | D8 |
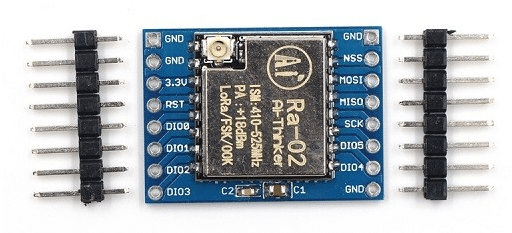
The LoRa module provides wireless communication between the distributed monitoring nodes.
USB Microphone:
A USB microphone is connected directly to the Linux side of the Arduino UNO Q through its USB port. The microphone is used to capture surrounding audio for the acoustic-analysis component of the system. The recorded audio is processed by the Python application using the YAMNet TensorFlow Lite model, which can identify potentially significant sounds such as alarms, sirens, screams, glass breaking, explosions, and gunshots.
Therefore, the complete hardware connection consists of the BMP280 and DHT22 for environmental monitoring, S3KM1110 for crowd-density sensing, SX1278 for LoRa-based node communication, and a USB microphone for acoustic event detection. The Arduino UNO Q combines the data from these different interfaces and passes the required information to its Linux-side processing system.
Webpage Explanation:
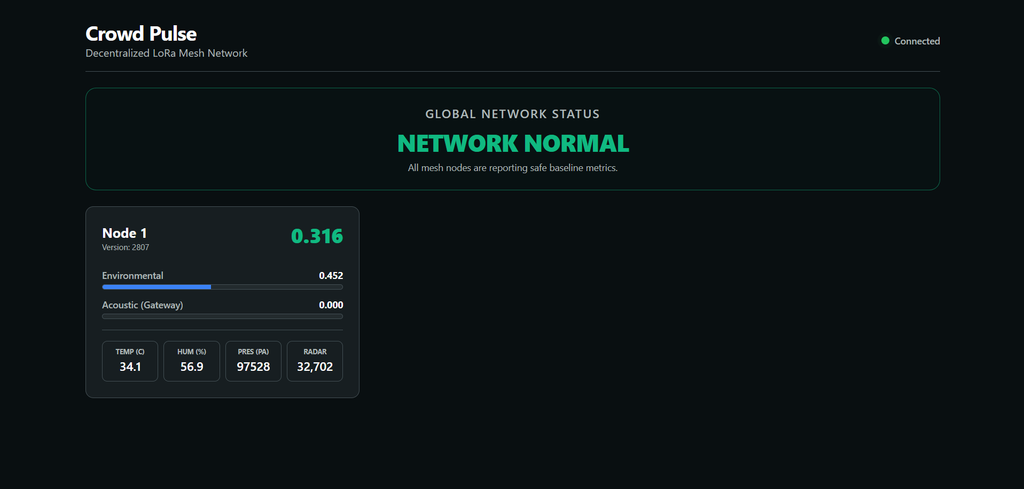
The project includes a Flask-based web dashboard that provides a real-time view of the crowd-monitoring network. The webpage is hosted by the Python application running on the Linux side of the Arduino UNO Q. The dashboard is designed to display the current status of the network, individual node information, environmental measurements, acoustic analysis, and the final event-detection status.
1. Header and Connection Status
The top section displays the Crowd Pulse project title and identifies the system as a Decentralized LoRa Mesh Network. On the right side, a status indicator shows whether the webpage is successfully communicating with the Flask server.
The webpage continuously checks the Flask API at: /api/status
If a response is received successfully, the status changes to Connected. If the API cannot be reached, it changes to Connection Lost.
2. Global Network Status
The Global Network Status section provides an overall indication of the current condition of the monitoring network.
The webpage checks the alert_state of all available nodes received from the Flask server. If at least one node exceeds the configured alert threshold, the dashboard displays:
- THREAT DETECTED
Otherwise, it displays:
- NETWORK NORMAL
This section therefore provides a quick overview without requiring the user to inspect every individual node.
3. Node Cards
The main portion of the webpage consists of dynamically generated Node Cards. A separate card is created for every node reported by the LoRa mesh network.
Each card displays:
- Node ID – identifies the individual monitoring node.
- Version – shows the version number of the node’s latest received data.
- Fused Score – displays the final combined environmental and acoustic score.
- Environmental Score – shows the anomaly score generated by the environmental machine-learning model.
- Acoustic Score – shows the acoustic anomaly score obtained from the USB microphone and YAMNet processing.
- Temperature – BMP280 temperature reading.
- Humidity – DHT22 humidity reading.
- Pressure – BMP280 atmospheric pressure reading.
- Radar – mmWave radar density value.
The node information is obtained from the network object returned by the Flask /api/status endpoint.
4. Environmental Anomaly Section
Inside each node card, the Environmental indicator represents the anomaly score calculated by the Python machine-learning pipeline.
The Flask server obtains the environmental sensor values from the Arduino UNO Q’s MCU side through the RouterBridge. The Python program then processes the values using the trained Isolation Forest model and generates the env_score.
The dashboard receives this value through:
- network → node ID → env_score
and displays it both numerically and as a progress bar.
5. Acoustic Analysis Section
The Acoustic (Gateway) section represents the acoustic score generated by the USB microphone connected to the Arduino UNO Q.
The Python application captures audio from the USB microphone using the Linux arecord interface. The audio is processed by the YAMNet TensorFlow Lite model, which searches for predefined potentially significant sound classes. The highest matching score is stored as the gateway acoustic score.
The Flask server provides this value through: gateway_acoustic
The webpage then displays this score on every node card because the current implementation uses a single gateway-wide acoustic score.
6. Sensor Information
The bottom section of each node card displays the raw sensor measurements received from the corresponding monitoring node.
The values are obtained from the metrics object:
metrics.bmp_temp
metrics.dht_humi
metrics.bmp_pres
metrics.radar_density
These values originate from the physical sensors connected to the UNO Q:
- BMP280 → Temperature and Pressure
- DHT22 → Humidity
- S3KM1110 → Radar Density
The data travels through the system as:
Sensors
↓
UNO Q MCU
↓
LoRa Mesh
↓
RouterBridge
↓
Python Processing
↓
Flask API
↓
/api/status
↓
Web Dashboard
7. Real-Time Updating
The webpage does not require manual refreshing. JavaScript calls the Flask /api/status endpoint once every second:
setInterval(fetchStatus, 1000);
The latest JSON data is retrieved from the Flask server and the node cards, sensor values, scores, and global network status are updated automatically.
Therefore, the webpage acts as the visualization layer of the system, while the actual sensor acquisition, LoRa communication, machine-learning analysis, audio processing, and event fusion are performed by the UNO Q and its Python backend.
Testing Procedure
The testing procedure is carried out in stages to verify the operation of the sensors, LoRa communication, Python processing, audio analysis, and web dashboard.
Step 1 – Hardware Connection
First, connect the BMP280, DHT22, S3KM1110 mmWave radar, and SX1278 LoRa module to the Arduino UNO Q according to the connection diagram. Connect the USB microphone to the USB port of the UNO Q for audio acquisition.
Check the power and ground connections of every module before powering the system.
Step 2 – Upload the Arduino Firmware
Open the sketch.ino file in the Arduino IDE and select the Arduino UNO Q as the target board. Compile the program and upload it to the board.
After uploading, verify that the UNO Q initializes the connected sensors and LoRa module correctly. The mmWave radar should also begin sending its UART report data.
Step 3 – Verify Sensor Measurements
Allow the system to operate for a few seconds and verify that the sensor values are being updated.
Check that:
- BMP280 provides temperature and pressure values.
- DHT22 provides temperature and humidity values.
- mmWave radar provides a changing radar-density value when people move within its detection area.
The sensor data is periodically collected by the MCU and placed into the node’s network state.
Step 4 – Test LoRa Communication
For a multi-node setup, program each UNO Q with a different MY_NODE_ID and connect the corresponding LoRa modules.
Power the nodes and place them within the required LoRa communication range. Verify that each node broadcasts its network state and that the other nodes receive and update the corresponding node information.
A change in one node’s sensor readings should eventually appear in the network state maintained by the other nodes.
Step 5 – Start the Python Processing
Open the Linux terminal on the UNO Q and navigate to the project’s Python directory.
Run the Python processing application:
cd ~/Uno_Q_Crowd_Pulse/python

python3 main_pipeline.py
The terminal should indicate that the environmental model, YAMNet acoustic inference engine, and decision-fusion engine have started successfully.
The Python application receives the MCU network data through:
arduino-app-cli monitor
↓
RouterBridge
↓
network_state
↓
Python application
Step 6 – Test the USB Microphone
Ensure that the USB microphone is connected to the UNO Q before starting the Python application.
Generate different normal and significant sounds near the microphone and observe the acoustic-processing output. The YAMNet model analyzes the recorded audio and calculates an acoustic score based on predefined sound categories.
The system specifically checks categories related to sounds such as:
- Scream
- Glass
- Gun
- Explosion
- Siren
- Shatter
- Smash
- Emergency
- Alarm
Step 7 – Test Environmental Anomaly Detection
Expose the monitoring node to different environmental and crowd conditions and observe the environmental anomaly score generated by the Isolation Forest model.
The system uses the following parameters for the environmental analysis:
- BMP280 temperature
- BMP280 pressure
- DHT22 temperature
- DHT22 humidity
- mmWave radar density
The resulting environmental score is then combined with the acoustic score.
Step 8 – Test Event Fusion
The system combines the two scores using:
Fused Score = (0.7 × Environmental Score) + (0.3 × Acoustic Score)The configured alert threshold is:
Alert Threshold = 0.70If the fused score reaches or exceeds 0.70, the corresponding node is marked as being in an alert state.
Step 9 – Test the Web Dashboard
Once the Python Flask server is running, open the dashboard from a device connected to the same network using the UNO Q’s IP address and port 5000.
The webpage should display:
- Network status
- Individual node cards
- Sensor readings
- Environmental anomaly score
- Acoustic score
- Fused score
- Alert status
- Radar-density information
The dashboard automatically requests updated information from: /api/status
approximately every second, allowing the displayed information to update without manually refreshing the webpage.
Step 10 – Final System Verification
Finally, verify the complete data flow:
Sensors + mmWave Radar
↓
Arduino UNO Q
↓
LoRa Mesh
↓
RouterBridge
↓
Python Processing
↙↘
Environmental USB Microphone
↓ ↓
ML Model YAMNet
↘↙
Decision Fusion
↓
Flask API
↓
Web Dashboard
The system is considered successfully tested when the sensor values are updated correctly, LoRa nodes exchange their data, the Python models process the incoming information, the USB microphone produces acoustic analysis results, the fused score is calculated, and the corresponding information is displayed correctly on the web dashboard.
Schematics