




It is a production-grade IoT fleet management system built with FastAPI, MQTT, Prometheus, and Grafana. Supports device registration, remote configuration, OTA firmware updates with automatic rollback, V2G arbitrage, predictive maintenance, geofencing, device shadows, and 6 AI agents.
Component List
| ID | Name | Designator | Quantity |
|---|---|---|---|
| 1 | M5Stack CoreS3-SE (ESP32-S3) — fleet edge gateway + local display | GW1 | 1 |
| 2 | MAX32630FTHR — ultra-low-power remote sensor node | SN1 | 1 |
| 3 | Arduino Uno Rev3 — sensor front-end / actuator controller | MOD1 | 1 |
| 4 | ESP32 DevKit (ESP32-WROOM-32) — field device / gateway | MOD2 | 1 |
| 5 | DHT22 temperature + humidity sensor (Uno pin D2) | S1 | 1 |
| 6 | MPU6050 accelerometer/gyro, I2C (vibration sensing) | S2 | 1 |
| 7 | BME280 temperature + humidity + pressure (sensor node) | S3 | 1 |
| 8 | SW-420 vibration sensor | S4 | 1 |
| 9 | NEO-6M GPS module (location / geofencing) | GPS1 | 1 |
| 10 | INA219 current sensor (battery monitoring) | I1 | 1 |
| 11 | HC-05 Bluetooth module (sensor-node → gateway bridge) | BLE1 | 1 |
| 12 | Relay module (actuator: siren / cutoff / indicators) | RL1 | 1 |
| 13 | LiPo battery 2000 mAh (gateway backup power) | BAT1 | 1 |
| 14 | CR2032 coin cell (sensor-node power) | BAT2 | 1 |
| 15 | 5 V AC-DC power module | MOD3 | 1 |
Software / infrastructure (runs on any Docker host — verified live during development): backend (FastAPI :8181), Mosquitto MQTT broker (:1883), Prometheus (:9090), Grafana (:3050), 5-device simulator.
Project Explanation Step by Step
Managing IoT devices at scale is broken. Operators push firmware over SSH or USB sticks, discover dead sensors only after data stops, fix rogue devices by hand, and charge EV batteries at peak grid prices. Fleet Commander solves all four problems with one unified, AI-driven platform that is already built, tested, and running with real MQTT-connected devices.
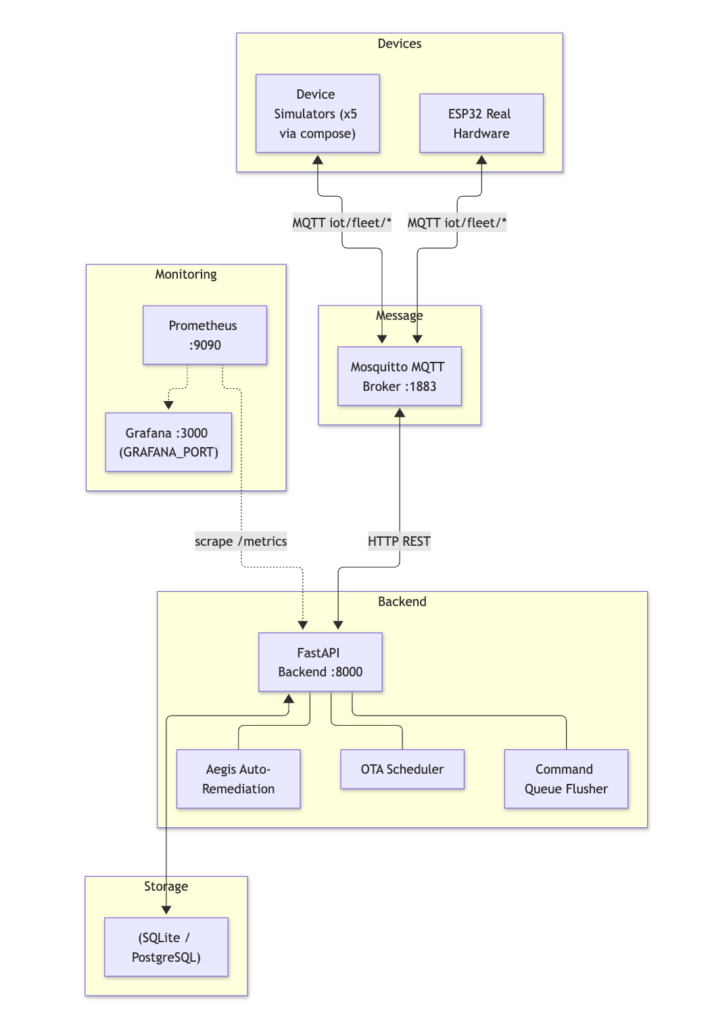
The system is a 3-tier architecture. At the bottom, constrained devices: an Arduino Uno sensor front-end (DHT22 temperature/humidity + MPU6050 vibration over I2C) streams compact JSON lines over Serial at 115200 baud to the ESP32 gateway — the Uno runs no network and no ML, which fits its 2 KB RAM. The middle tier is the ESP32 edge gateway (M5Stack CoreS3-SE / ESP32 DevKit): it reads the serial sensor lines, runs a threshold verdict engine (temperature slope and maximum, signal-strength slope over 12-sample rolling windows) as on-device edge AI, and publishes MQTT heartbeats every 15 seconds. The top tier is the cloud backend: FastAPI + Mosquitto + PostgreSQL/SQLite, fully containerized.
Every heartbeat carries telemetry (temperature, humidity, vibration, signal strength, battery SOC/SOH, GPS). The backend records it as time-series, evaluates geofences (circle/polygon enter/exit on a live Leaflet map), maintains a versioned device shadow / digital twin (desired vs reported state), and feeds six AI agents: an OTA campaign planner (10% canary → phased rollout with automatic rollback), a fleet-health anomaly detector, a device-grouping agent, a V2G dispatch agent that schedules charge/discharge against real spot electricity prices, an onboarding agent with conflict detection, and a predictive-maintenance agent using trend analysis plus an eval-gated IsolationForest model.
Self-healing comes from the Aegis auto-remediation engine: 8 rules (restart stuck devices, roll back bad firmware, calm alert storms) with a dead-letter queue and dry-run mode, wired into an alerting pipeline with dedup, cooldown, escalation, and Slack/email/webhook delivery. Firmware updates are Ed25519-signed and SHA256-verified; a hash mismatch automatically rolls the device back to its previous firmware with zero human intervention. Commands to offline devices wait in an offline command queue and deliver on reconnect.
Unlike typical IoT demos (manual updates, one chatbot, no self-healing, a handful of devices), this platform does canary OTA with automatic rollback, runs 6 specialized agents, heals itself via Aegis, targets 10,000+ devices with shadow sync and bulk provisioning, arbitrages energy with V2G, and exposes ~57 Prometheus metric families with pre-provisioned Grafana dashboards. It is a fully functional production-grade system: 137 unit tests + 57 end-to-end tests passing, running in Docker with 5 virtual devices (3 EVs) plus real ESP32/ESP8266 hardware on the same MQTT broker.
Coding Explanation and Configuration
Firmware (Arduino IDE)
Install these libraries via Sketch → Manage Libraries:
PubSubClientby Nick O’Leary (MQTT)ArduinoJsonby Benoit Blanchon (v6, JSON)DHT sensor library+Adafruit MPU6050+Adafruit Sensor(sensor node)ArduinoOTA,WiFi,Update,HTTPClient(ESP32 built-in / included)
Two sketches ship in the repo: arduino/sensor_node/sensor_node.ino (Uno: samples DHT22 on pin D2 + MPU6050 over I2C every 500 ms, prints one JSON line per sample: {"t":26.4,"h":61.2,"ax":0.02,...}) and ESp32-FleetManagement/ESp32-FleetManagement.ino (ESP32: MAC-based device ID, WiFi + MQTT with 15 s heartbeat, edge threshold engine, real OTA flashing via the Update class with SHA256 verification, plus an esp8266_OTA.ino variant).
Configure per device at the top of the ESP32 sketch: WIFI_SSID, WIFI_PASSWORD, MQTT_BROKER (broker IP/hostname), DEVICE_NAME, FW_VERSION. Set HAS_SENSORS to 1 when the DHT22+MPU6050 are wired over I2C, 0 to run with simulated sensors.
Backend (no code changes needed to run)
Prerequisites: Docker + Docker Compose v2. Then:
cd fleet-management
docker compose --profile demo up --build -d
docker compose ps   # backend, mosquitto, simulator, prometheus, grafana → Up
Key stack: Python 3.12 + FastAPI (~115 REST endpoints, Swagger at /docs), SQLAlchemy async (SQLite dev / PostgreSQL prod), paho-mqtt (MQTT v5, QoS 1), Jinja2 + Tailwind + Chart.js + Leaflet dashboard, Prometheus + Grafana observability, pytest (137 unit + 57 E2E). MQTT topics follow iot/fleet/{device_id}/heartbeat|obd|bms|status/ota|register (device → cloud) and iot/fleet/{device_id}/command/ota|config|v2g|restart|rollback|shadow|maintenance (cloud → device); OTA lifecycle is pending → downloading → applying → verifying → success, with hash_mismatch → rollback → rolled_back or failed on timeout.
Dashboard (Web App) Setup
This project uses a web dashboard instead of a phone app — no APK needed. With the stack running, open:
- Fleet Dashboard: http://localhost:8181 (login: admin / adminadmin)
- API docs (Swagger): http://localhost:8181/docs
- Prometheus: http://localhost:9090
- Grafana: http://localhost:3050 (admin / admin)
The dashboard shows the device table (status, firmware, signal, battery), telemetry trend charts (Chart.js), the live fleet map (Leaflet with city-colored markers), OTA lifecycle tracking, geofence editor, digital-twin view, maintenance panel, and agent recommendation cards, with auto-refresh every 5 seconds (pausable).
Connection Explanation
Wire the tiers as follows. Arduino Uno → ESP32 gateway: Uno TX → ESP32 RX2, Uno RX → ESP32 TX2, common GND; DHT22 data → Uno D2 (+5 V/GND); MPU6050 SDA/SCL → Uno A4/A5 over I2C. The Uno only speaks Serial JSON (115200 baud) — no WiFi on the Uno side. ESP32 gateway → cloud: WiFi to your router; MQTT to the broker (MQTT_BROKER = host LAN IP running Mosquitto, port 1883, anonymous in demo / mTLS on 8883 in production). GPS (NEO-6M) and relay module attach to the gateway for location and actuation (relay COM = LIVE in, NO = appliance LIVE out; neutral straight to the appliance). Power the logic side from the 5 V AC-DC module (Uno + gateway), gateway backup via 2000 mAh LiPo, remote sensor node via CR2032 with 15-minute deep-sleep wake cycles, bridged over BLE (HC-05) to the gateway. Cloud side: Mosquitto ↔ FastAPI backend (:8181) ↔ SQLite/PostgreSQL; Prometheus scrapes /metrics; Grafana reads Prometheus. After wiring, fix the display/gateway in its enclosure with the screen exposed.
Testing
- Check wiring for shorts, then power the 5 V logic side (do not connect AC appliances yet).
- Start the stack:
docker compose --profile demo up -d; confirmdocker compose psshows all five services Up. - Open http://localhost:8181 — the ESP32/gateway should auto-register on first heartbeat and appear with green status and firmware
1.0.0. - Press through the dashboard: device detail modal → telemetry chart moves with each heartbeat; walk the GPS unit across a geofence → enter/exit alert fires on the map.
- Trigger OTA Update from the dashboard (firmware
2.0.0, all online devices): within 10–15 s most devices showsuccess; the simulator’s 20% failure rate forces at least onehash_mismatch→rolled_backstaying on1.0.0— automatic, no intervention. - Verify self-healing: stall a device → Aegis rule restarts it; check
Aegis summaryand the alert pipeline (dedup/cooldown/escalation). - Open Prometheus (
:9090) → fleet targetsup; Grafana (:3050) → pre-provisioned fleet dashboards render. - Full regression any time:
docker compose --profile testing run --build --rm tests(57 E2E tests).
Project website: click here
Interactive architecture diagram: click here
Repo contents: FastAPI backend (app/, ~115 endpoints), device simulator (simulator/, 5 virtual devices incl. 3 EVs), firmware (arduino/sensor_node/, ESp32-FleetManagement/), Docker profiles (demo/testing/production), Prometheus + Grafana configs (docker/), full test suite (tests/, 137 unit + 57 E2E), docs (README, architecture, DEMO_GUIDE, ESP32_GUIDE, SECURITY, CUDO).
