




The air around us rarely announces itself. Exhaust from a busy road, dust from a building site, smoke from burning leaves, fumes from a kitchen, or a closed room slowly running out of fresh air — most of it is invisible, and almost none of it is measured.
Atmosis is a small device that watches the air every second and tells you what’s going on. It turns nine sensor readings into one simple air score from 1 to 100, recognises the situation behind the numbers with an Edge Impulse model, and uses Gemini 3.5 Flash to suggest exactly what to do — on a live dashboard and on your phone through Telegram.
The safety features run on the board itself, so the light strip and the dust and carbon-monoxide alarms keep working even without the app or the internet.
Next Builder (YouTube, Instructables and Hackster)
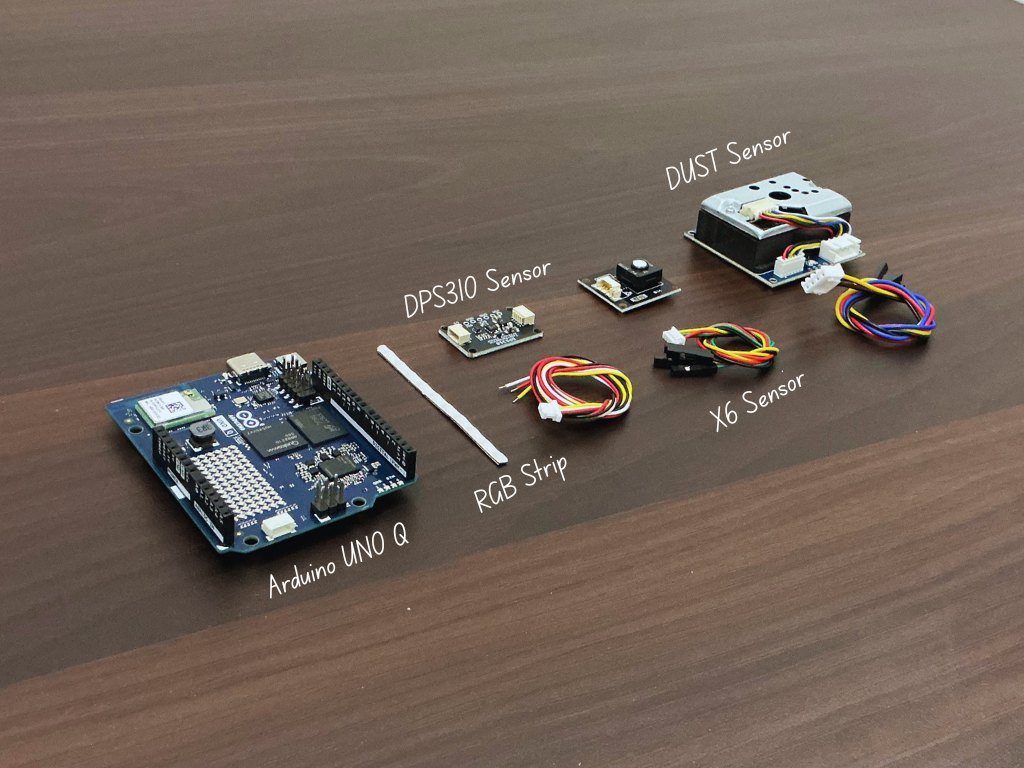
Component List:
| ID | Name | Designator | Quantity |
|---|---|---|---|
| 1 | Arduino UNO Q | MOD1 | 1 |
| 2 | Waveshare Environment X6 sensor | U1 | 1 |
| 3 | Waveshare Dust Sensor (Sharp GP2Y1010) | U2 | 1 |
| 4 | DPS310 pressure sensor | U3 | 1 |
| 5 | Waveshare RGB COB LED strip (WS2812B) | LED1 | 1 |
| 6 | JST connector cables | W1–W4 | 4 |
| 7 | 3D-printed enclosure (housing and cover) | ENC1 | 1 |
| 8 | USB-C cable | PWR | 1 |
Tools: soldering iron, solder wire, pliers and a 3D printer.
Project Explanation Step By Step
We usually think of an air-quality monitor as a device that measures the room and shows a few numbers. But those numbers don’t always tell us what is actually happening, or what we should do about it. Atmosis was built to bridge that gap.
Atmosis is an environmental monitoring and advisory system built around the Arduino UNO Q. It combines real-time sensing, edge machine learning, a Linux application, generative AI and Telegram notifications to turn raw sensor data into information a person can act on.
The system monitors IAQ, TVOC, formaldehyde (HCHO), carbon monoxide (CO), temperature, humidity, PM2.5, pressure and altitude. Instead of treating each value on its own, it looks at how they change together. An Edge Impulse model, trained on data from these same sensors, recognises conditions such as clean air, indoor pollution and poor ventilation, and it runs locally on the board.
When something needs attention, Google Gemini turns the processed data into a short, plain-language recommendation. Gemini does not take the measurements or make safety decisions; it only explains what the device has already found. Personal sensitivity settings stay on the UNO Q, and only environmental data and a privacy-safe sensitivity level are sent to the AI service.
The core monitoring and safety functions don’t depend on the Internet. If the cloud services or the Linux application stop, the microcontroller keeps monitoring and keeps the hardware alarms working.

How Atmosis Works
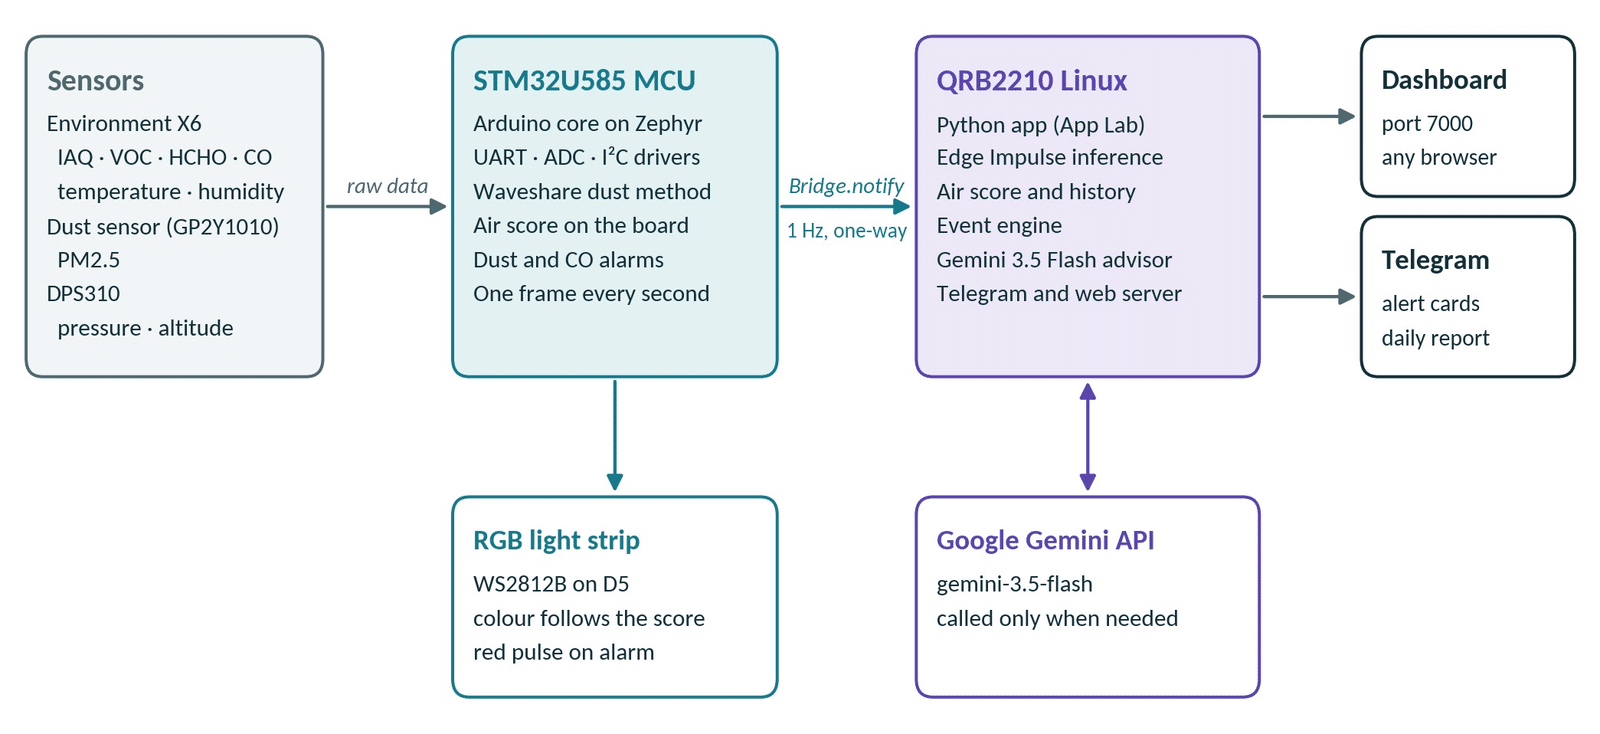
Atmosis follows a simple flow: Sense → Understand → Interpret → Respond. The UNO Q makes this possible because it has two processors on one board.
- The STM32U585 microcontroller reads the three sensors in a non-blocking loop, calculates the air score, drives the WS2812B status light and handles the PM2.5 and CO alarms.
- Once per second it sends a compact data frame to Linux through the Arduino Router Bridge. The link is one-way, so the real-time side never depends on Linux.
- The Qualcomm QRB2210 runs Linux. The Python app validates each frame, keeps the history, runs the Edge Impulse model on a rolling window of the nine readings and decides when an event needs attention.
- When it does, the processed data goes to Gemini for a recommendation, and the result is shown on the local dashboard and sent through Telegram.
Step 1: Design in Fusion 360
I designed the enclosure from scratch in Autodesk Fusion 360. I started with the basic shell, then added the mounting points, openings and component positions around the actual hardware. Each sensor has its own cut-out for airflow, and the mounting features and snap-fit lid are built into the design.
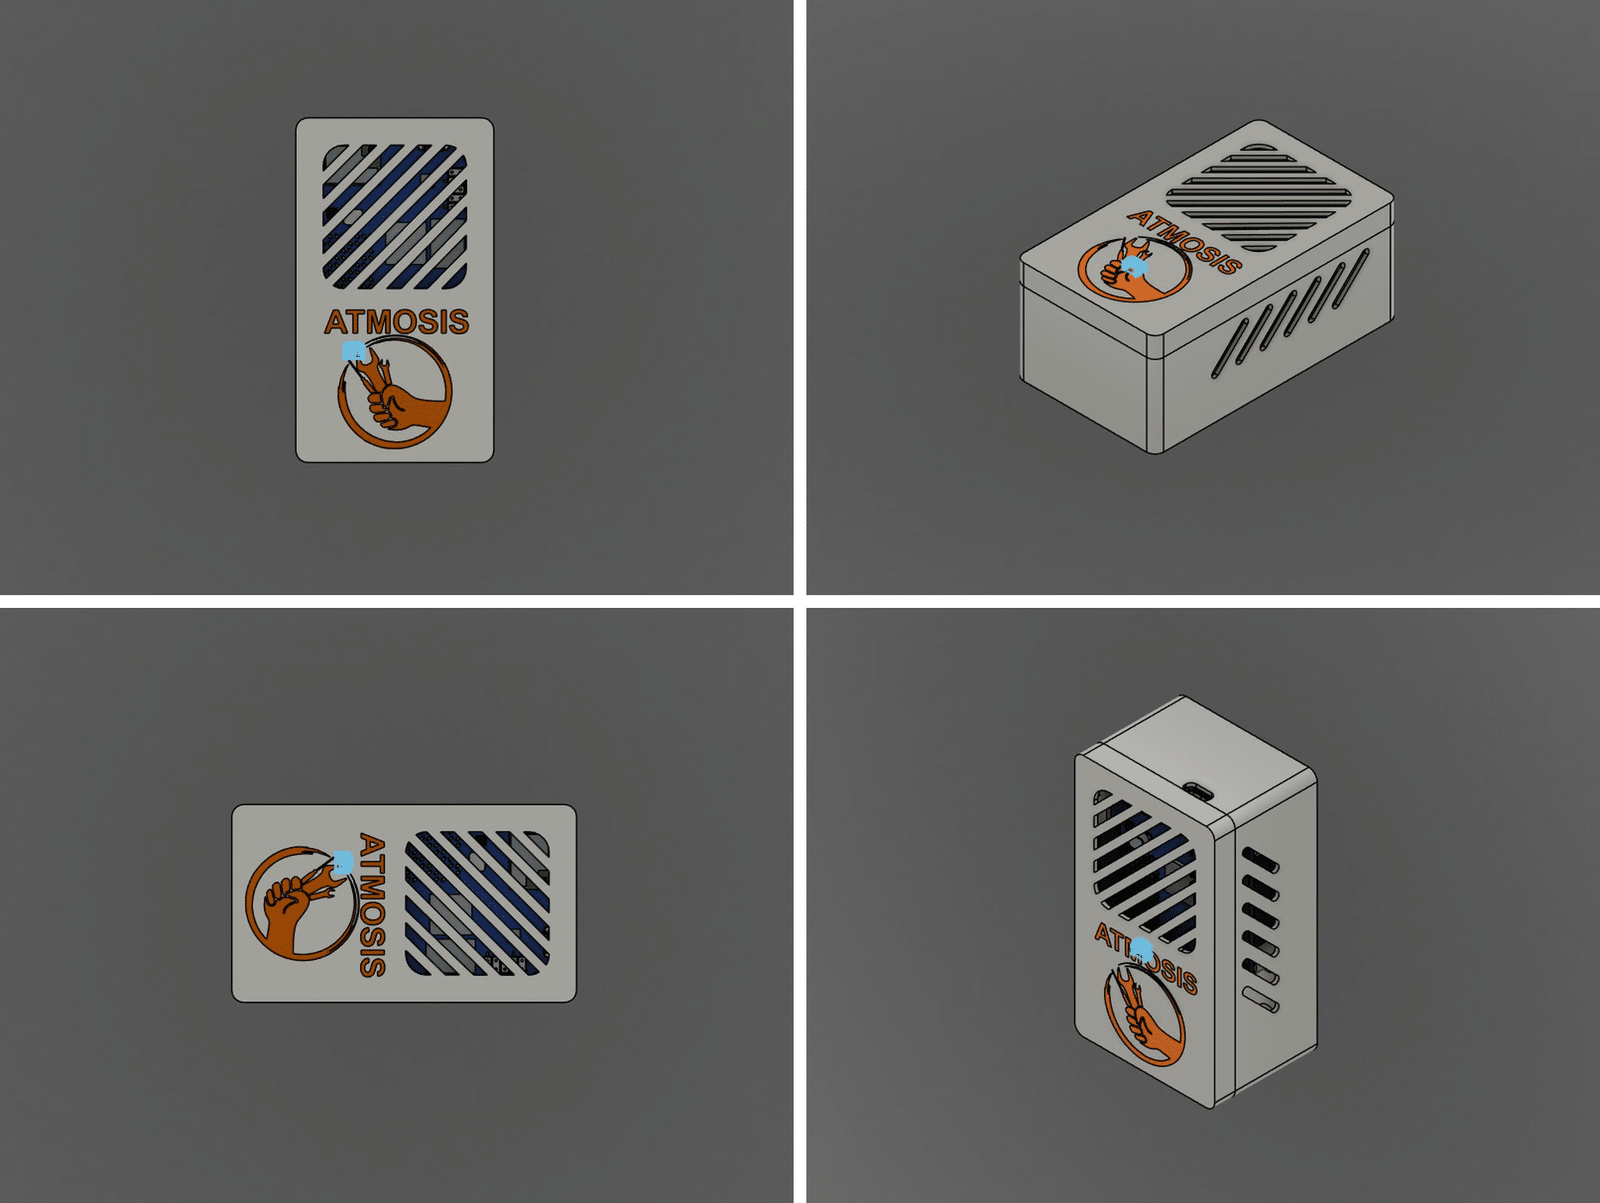
The print files (Housing.stl and Cover.stl) are in the CAD Design folder of the GitHub repository.
Step 2: 3D Printing
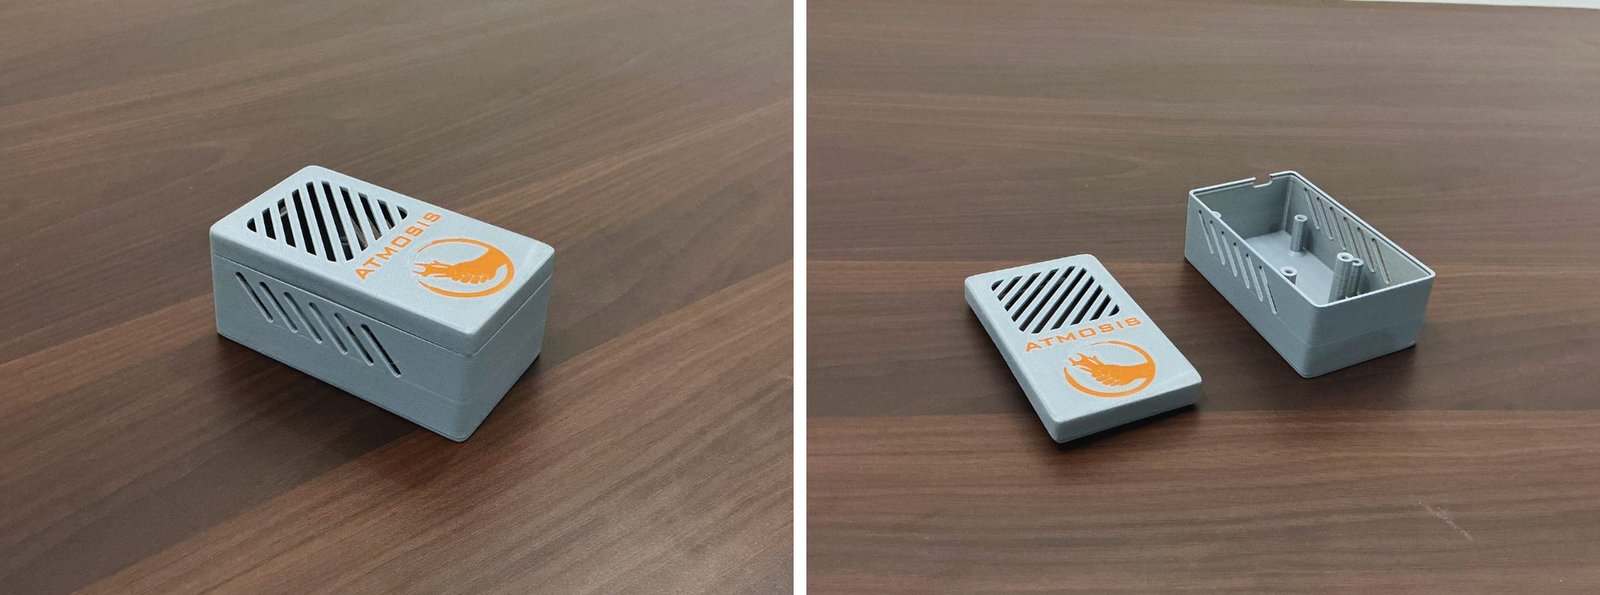
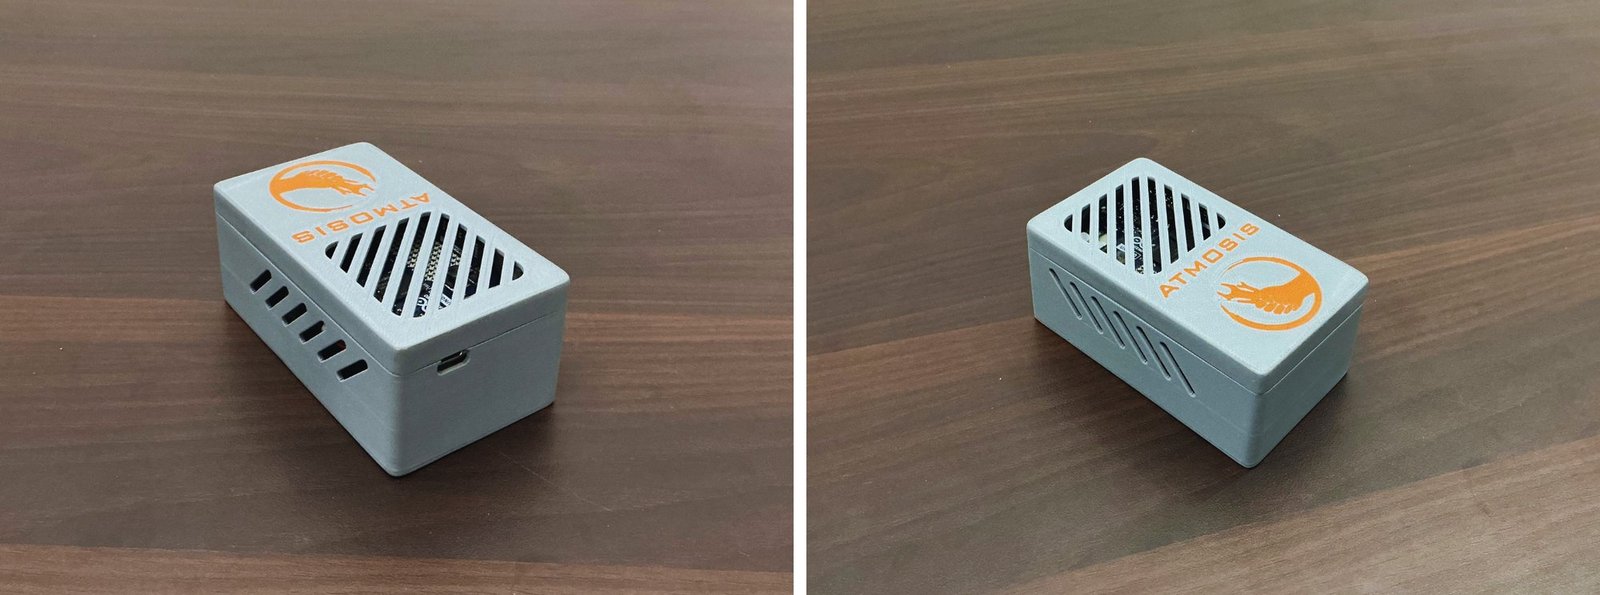
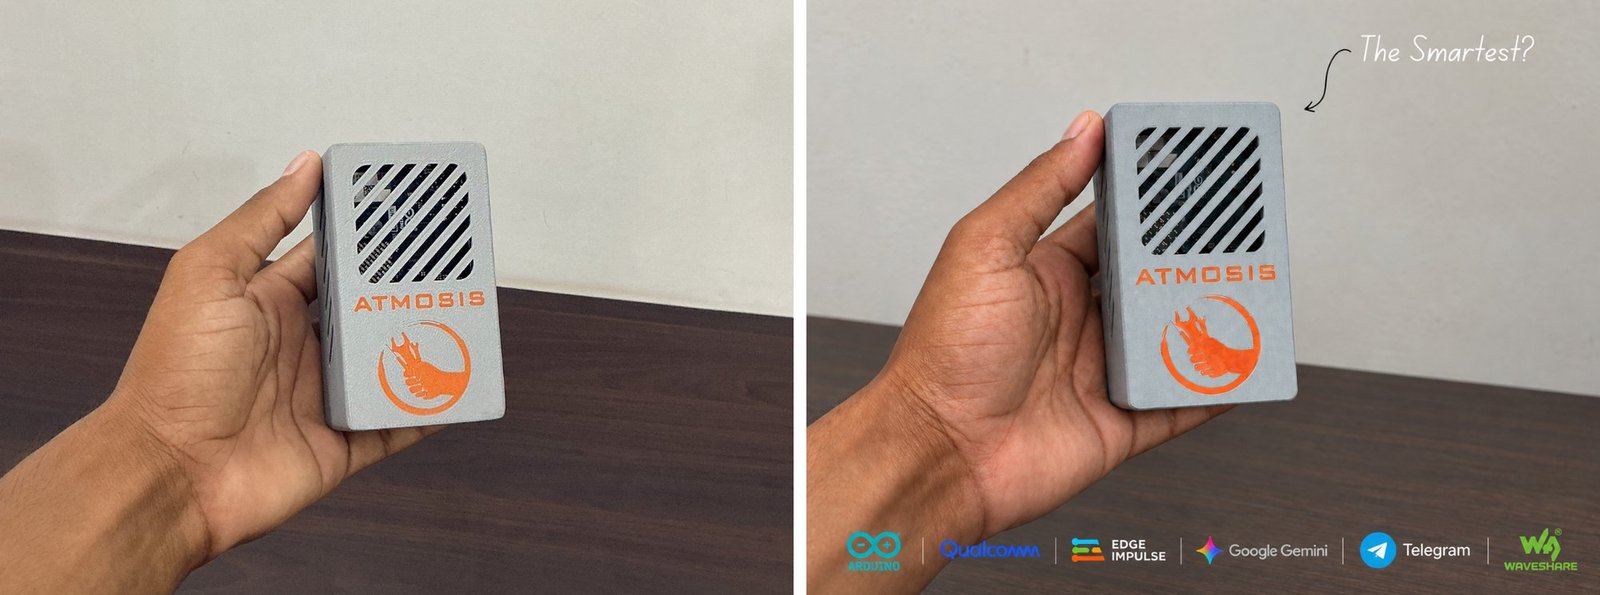
I printed the enclosure in grey PLA and used orange PLA for the text and logo. The two colours give it a simple, modern finish while keeping the details clearly visible.
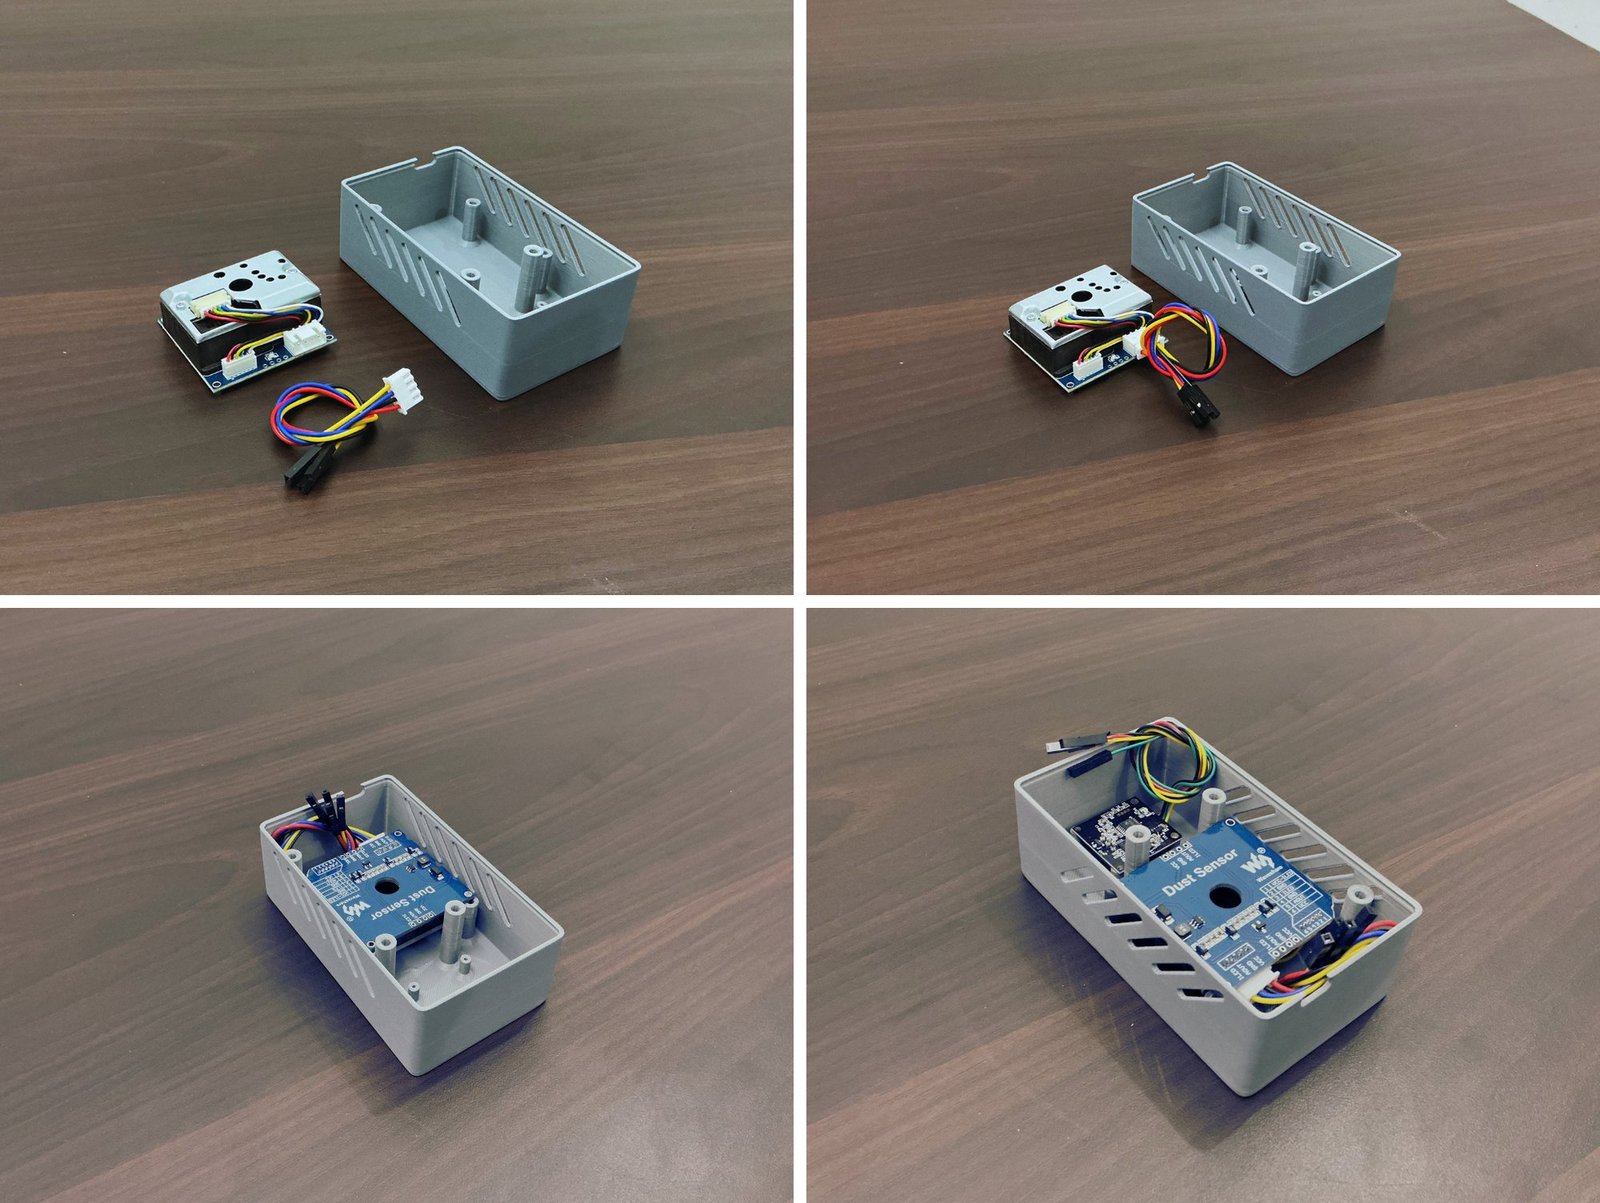
Step 3: Dust Sensor Assembly
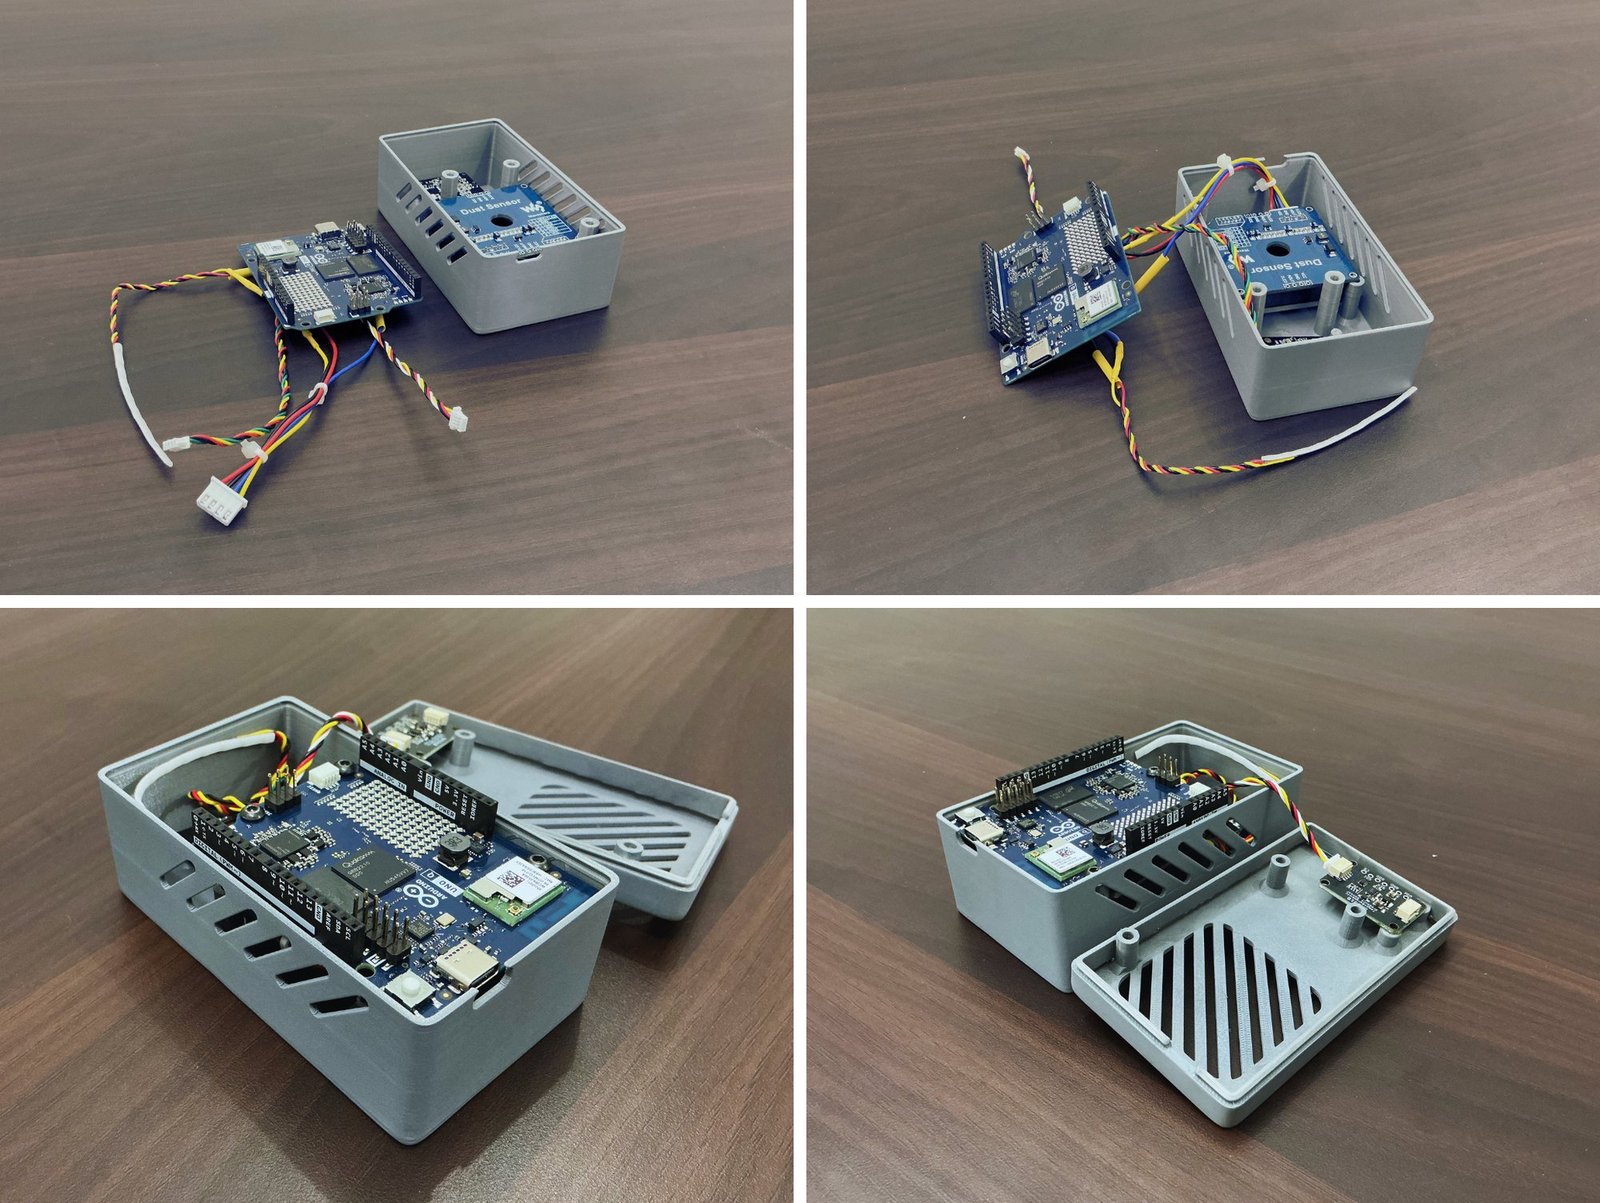
The dust sensor measures airborne particles and gives Atmosis a live PM2.5 reading. Connect the sensor to its cable, place it in its mount inside the housing, line it up with the mounting holes and fix it with the screw.
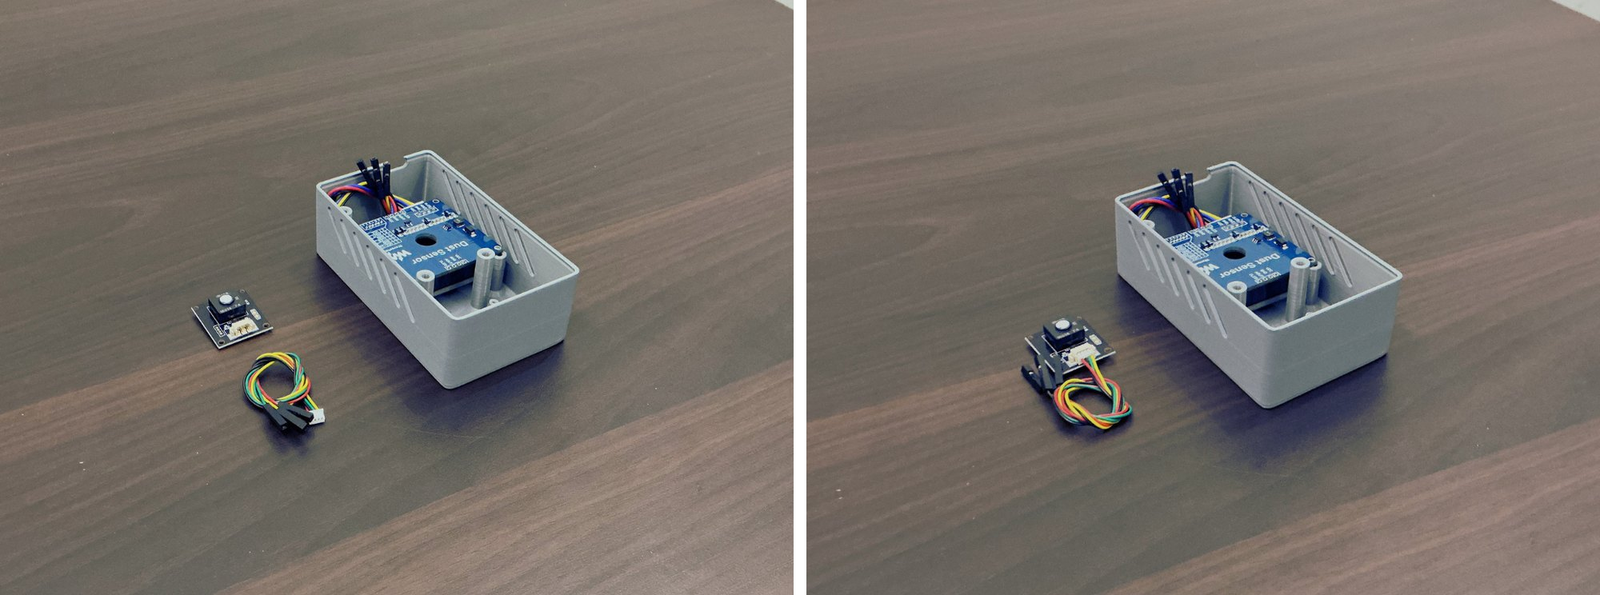
Step 4: X6 Sensor Assembly
The Waveshare Environment X6 is a multi-gas sensor that measures IAQ, TVOC, HCHO and CO, along with temperature and humidity. It talks to the UNO Q over UART. Connect its cable, place it in position and fix it with the screw. Keep the sensing area clear so room air can reach it.
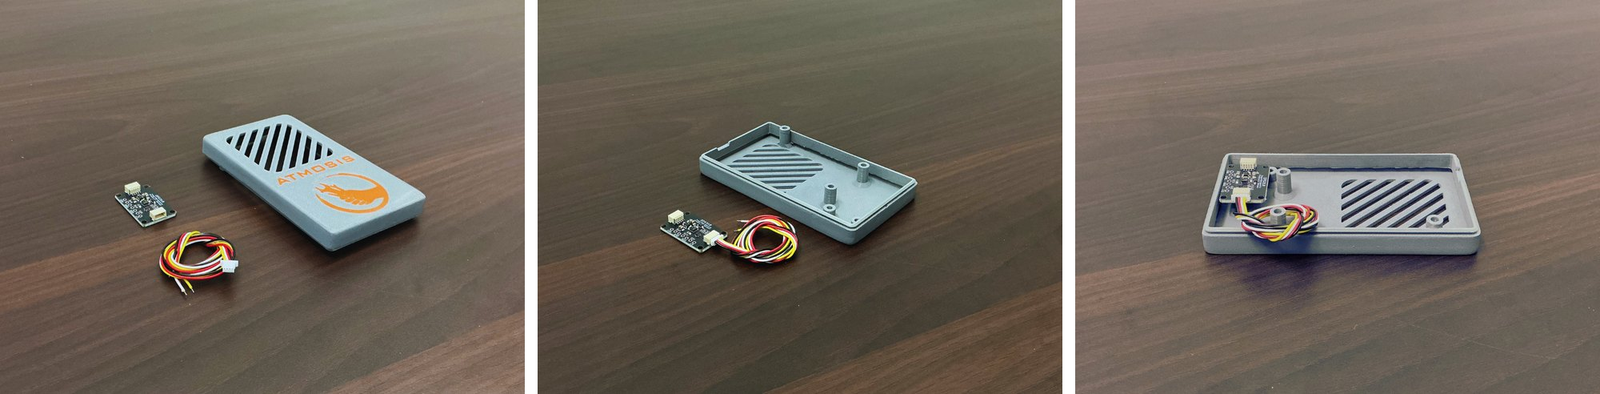
Step 5: DPS310 Sensor Assembly
The DPS310 is a barometric pressure sensor, and Atmosis also uses it to calculate altitude. Connect its cable, place it in the opening on the top cover and fix it with the screw. Leave the opening unobstructed for accurate readings.
Connection Explanation
Connect each sensor and the RGB strip to the UNO Q as shown below. The X6, dust sensor and LED strip run on 5V; the DPS310 runs on 3.3V.
| Module | Module pin | UNO Q pin |
|---|---|---|
| Waveshare X6 | VCC / GND | 5V / GND |
| TXD / RXD | D0 / D1 | |
| Dust sensor | VCC / GND | 5V / GND |
| ILED / AOUT | D4 / A0 | |
| DPS310 | VCC / GND | 3.3V / GND |
| SDA / SCL | SDA / SCL | |
| RGB LED strip | DIN | D5 |
| VCC / GND | 5V / GND |
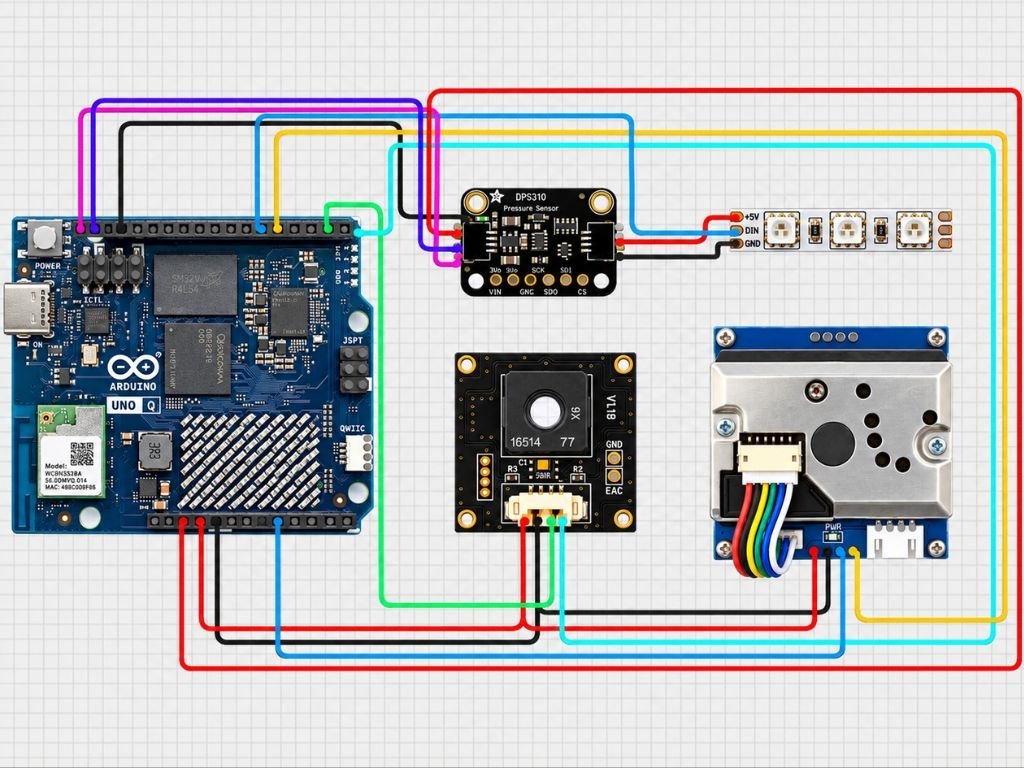
For a neat assembly, I first connected all the JST cables to the UNO Q following the wiring diagram, then connected the other ends to the sensors.
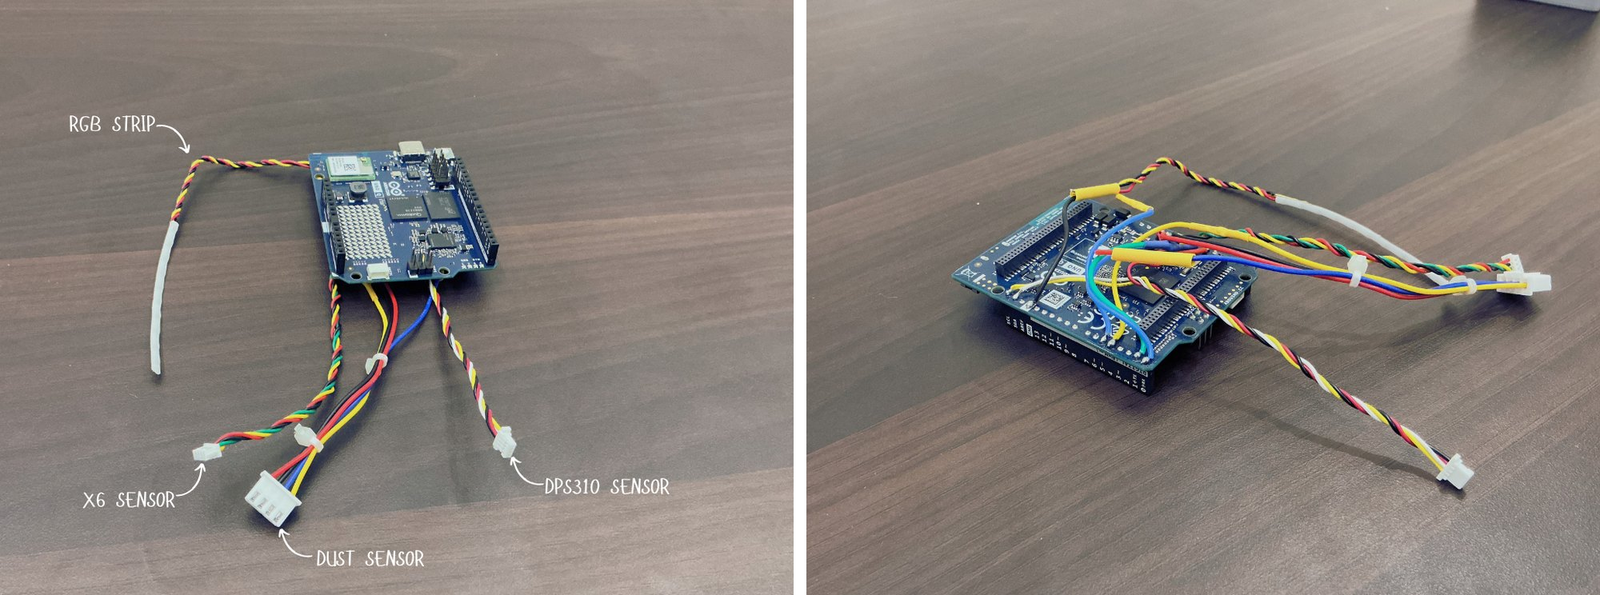
Note: On the UNO Q, the X6 uses the hardware Serial1 port on D0 and D1. The dust sensor module has a voltage divider on its output, so the firmware multiplies the measured voltage by 11 to get the real sensor voltage.
Step 6: Arduino UNO Q Assembly
With the cables connected, place the UNO Q in its position inside the housing. Arrange the wires around the board so they don’t press on the other parts, then fix the board with the mounting screws.
Step 7: RGB LED Strip Assembly
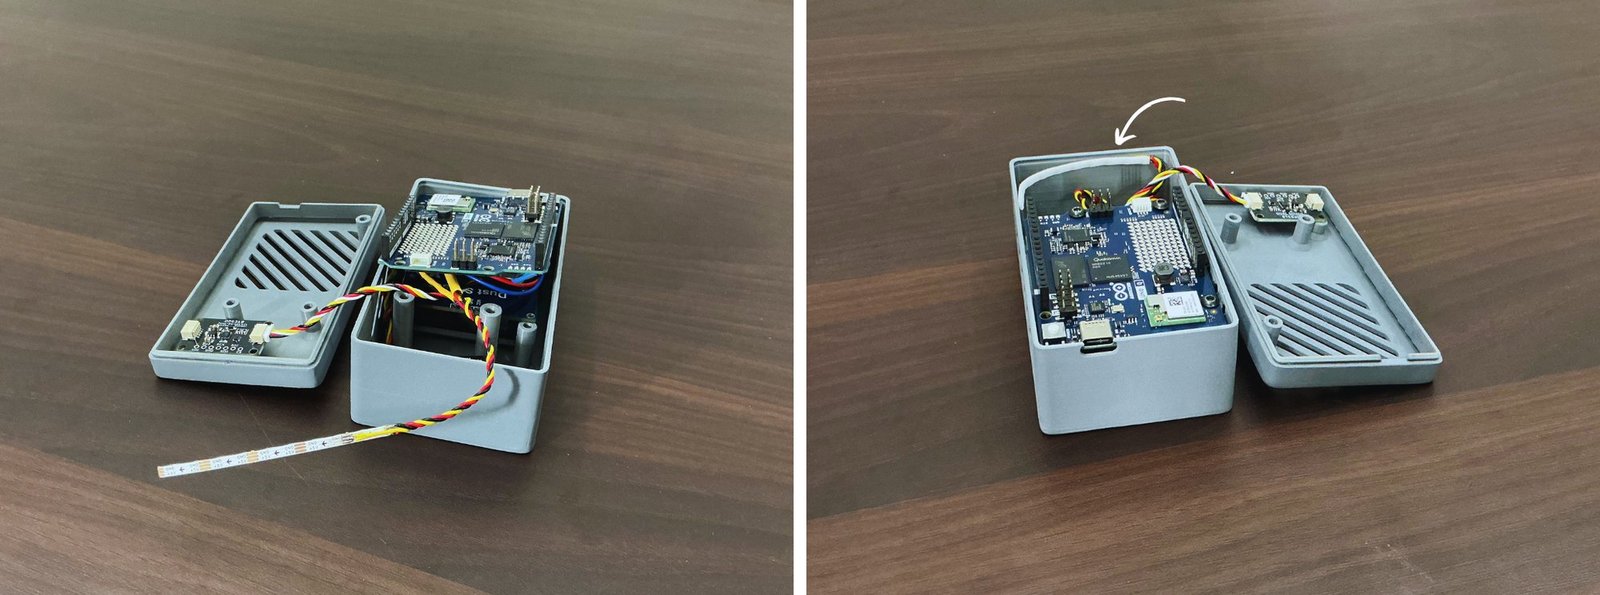
For visual feedback I used the Waveshare ultra-slim RGB COB strip. It’s thin enough to fit inside the enclosure and gives bright, diffused light. The strip uses WS2812B LEDs, so Atmosis can set its colour as a live status indicator. Cut the length you need, peel off the backing and stick it to a flat surface inside the enclosure.
Step 8: Final Assembly
Place the top cover on the housing, line up the snap-fit tabs with the slots and press down evenly until all the clips lock.
Coding Explanation and Configuration
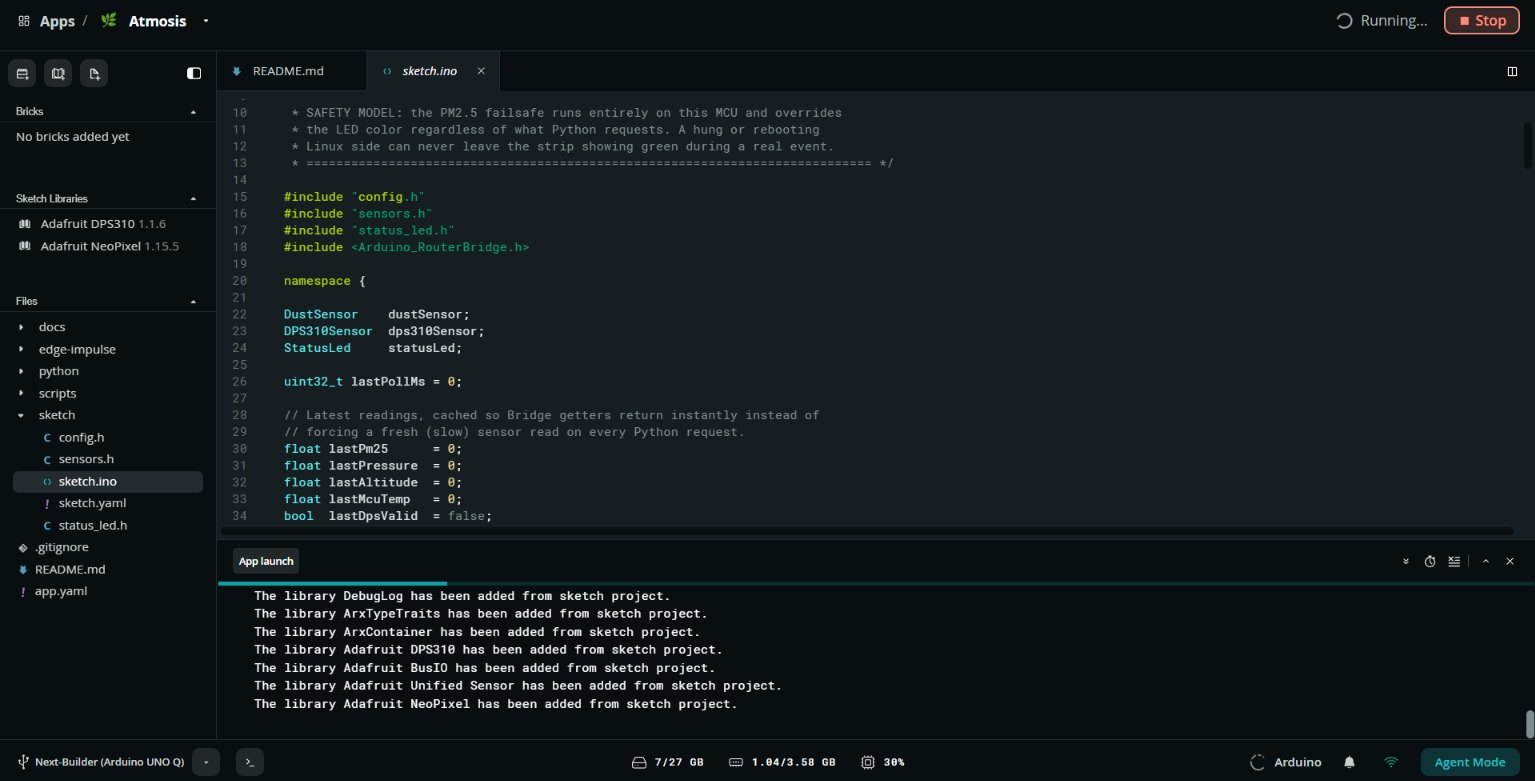
All the code for Atmosis is on GitHub: https://github.com/NextBuilder/Atmosis. The project has two parts that run together: an Arduino sketch on the STM32U585 and a Python application on the Linux side. Arduino App Lab builds and runs both as one app.
Setting Up the Software
- Install the latest Arduino IDE. Open Tools → Board → Boards Manager, search for Arduino UNO Q and install the official board package.
- Install Arduino App Lab from the official Arduino software page. Connect the UNO Q with a USB-C data cable; App Lab detects the board and walks you through the initial setup.
Build Configuration
App Lab builds the project from two small files. app.yaml names the app and opens port 7000 for the dashboard. sketch.yaml selects the UNO Q board profile and pins each library to an exact version, so every build uses the same code.
sketch/sketch.yaml
profiles:
  default:
    fqbn: arduino:zephyr:unoq
    platforms:
      - platform: arduino:zephyr
    libraries:
      - Adafruit DPS310 (1.1.6)
      - Adafruit BusIO (1.17.3)
      - Adafruit Unified Sensor (1.1.15)
      - Adafruit NeoPixel (1.15.5)
default_profile: default
All firmware constants such as pins, timings, sensor ranges and alarm thresholds are in config.h. Compile-time checks stop an invalid configuration from reaching the board.
sketch/config.h (excerpt)
constexpr uint32_t FRAME_INTERVAL_MS     = 1000;
constexpr uint32_t LOOP_YIELD_MS         = 4;
constexpr uint8_t  FRAME_PROTOCOL        = 5;

constexpr float DUST_ALERT_UGM3          = 150.0f;
constexpr float DUST_ALERT_CLEAR_UGM3    = 130.0f;
constexpr float CO_ALERT_PPM             = 9.0f;
constexpr float CO_ALERT_CLEAR_PPM       = 8.0f;

static_assert(DUST_ALERT_CLEAR_UGM3 < DUST_ALERT_UGM3, "Dust hysteresis must be positive");
static_assert(CO_ALERT_CLEAR_PPM < CO_ALERT_PPM, "CO hysteresis must be positive");
static_assert(DUST_SAMPLE_DELAY_US == 280, "Sample point is 280 us after LED on");
Firmware: The Real-Time Layer
The firmware is fully non-blocking. Every pass of loop() gives each sensor driver a short turn and then checks whether it’s time to send a frame. No driver waits for a sensor, so a slow or disconnected sensor can’t freeze the board. Timing is wrap-safe, frames stay on a steady one-second schedule, and a short delay(4) hands time back to Zephyr on every pass.
sketch/sketch.ino: loop()
void loop() {
  const uint32_t now = millis();
  trackLoopTime(now);

  statusLed.update(now);
  x6Sensor.poll(now);
  lastX6 = x6Sensor.reading(now);
  dustSensor.poll(now);
  pressureSensor.update(now);

  DustReading dust;
  if (dustSensor.consume(dust)) {
    lastDust = dust;
    if (dust.valid) {
      if (dust.density_ugm3 >= DUST_ALERT_UGM3) dustAlarm = true;
      else if (dust.density_ugm3 <= DUST_ALERT_CLEAR_UGM3) dustAlarm = false;
    }
  }

  if ((int32_t)(now - nextFrameMs) >= 0) {
    nextFrameMs += FRAME_INTERVAL_MS;
    if ((int32_t)(now - nextFrameMs) >= 0) nextFrameMs = now + FRAME_INTERVAL_MS;
    updateAlarmsAndLight();
    pushFrame(now);
  }

  if ((int32_t)(now - nextInfoMs) >= 0) {
    nextInfoMs = now + INFO_INTERVAL_MS;
    pushInfo();
  }

  delay(LOOP_YIELD_MS);
}
Sensor drivers
The X6 answers a two-byte query with a 22-byte frame. The driver sends one query per second and collects the reply over later loop passes with a 250 ms timeout. A frame is accepted only if its checksum is correct and every value is within the sensor’s range. If no valid frame arrives for 3.5 seconds, the reading is marked as stale.
The dust sensor has to be read exactly 280 µs after its IR LED switches on, following Waveshare’s method. The firmware takes ten pulses per batch, drops the highest and lowest 20% to remove spikes, corrects for the module’s voltage divider and converts the result to µg/m³.
sketch/sensors.h: dust sensor
void pulse() {
  digitalWrite(PIN_DUST_ILED, HIGH);
  const uint32_t start = micros();
  waitUntil(start, DUST_SAMPLE_DELAY_US);
  const int raw = analogRead(PIN_DUST_AOUT);
  digitalWrite(PIN_DUST_ILED, LOW);
  lastPulseUs_ = start;
  if ((uint32_t)(micros() - start) > DUST_PULSE_MAX_US) timingOk_ = false;
  if (raw < 0) { failed_++; return; }
  if (raw >= (int)ADC_MAX_COUNT - 2) saturated_++;
  samples_[count_++] = raw;
}

inline float dustDensityFromSensorMv(float sensorMv) {
  if (sensorMv <= DUST_ZERO_MV) return 0.0f;
  const float d = (sensorMv - DUST_ZERO_MV) * DUST_UGM3_PER_MV;
  return d > DUST_MAX_UGM3 ? DUST_MAX_UGM3 : d;
}
The DPS310 driver checks the chip ID before starting, applies Infineon’s temperature fix and samples at 4 Hz with 16× oversampling. If the sensor stops responding, it is marked as lost and detected again automatically every 10 seconds.
Air score
Each pollutant gets a sub-score from 100 to 0 based on WHO and US EPA indoor guidance, with linear interpolation between breakpoints. The overall score is the lowest sub-score, because the air is only as good as its worst pollutant. The Python app uses the same table, and the tests check that both sides agree.
| Pollutant | 100 | 85 | 65 | 45 | 20 | 0 |
|---|---|---|---|---|---|---|
| PM2.5 (µg/m³) | 0 | 12 | 35 | 55 | 150 | 250 |
| TVOC (ppm) | 0 | 0.3 | 0.5 | 1.0 | 3.0 | 5.0 |
| HCHO (ppm) | 0 | 0.03 | 0.08 | 0.3 | 0.75 | 1.0 |
| CO (ppm) | 0 | 2 | 4.5 | 9 | 15 | 35 |
| IAQ | 0 | 50 | 100 | 150 | 250 | 400 |
sketch/air_score.h
constexpr ScoreEdges EDGES_PM   = {{0, 12, 35, 55, 150, 250}};
constexpr ScoreEdges EDGES_TVOC = {{0, 0.3f, 0.5f, 1.0f, 3.0f, 5.0f}};
constexpr ScoreEdges EDGES_HCHO = {{0, 0.03f, 0.08f, 0.3f, 0.75f, 1.0f}};
constexpr ScoreEdges EDGES_CO   = {{0, 2, 4.5f, 9, 15, 35}};
constexpr ScoreEdges EDGES_IAQ  = {{0, 50, 100, 150, 250, 400}};
constexpr float SUBSCORES[6]    = {100, 85, 65, 45, 20, 0};

inline float subScore(float v, const ScoreEdges& edges) {
  if (v <= edges.e[0]) return 100.0f;
  for (int i = 1; i < 6; ++i) {
    if (v <= edges.e[i]) {
      const float f = (v - edges.e[i - 1]) / (edges.e[i] - edges.e[i - 1]);
      return SUBSCORES[i - 1] + (SUBSCORES[i] - SUBSCORES[i - 1]) * f;
    }
  }
  return 0.0f;
}
Status light and alarms
Once per frame, the firmware updates the CO alarm (with hysteresis), converts the score to a colour and sends both to the LED strip. Colour changes fade smoothly over 600 ms, and during an alarm the strip pulses red. Because this all runs on the microcontroller, the light and alarms keep working even if the Linux app is stopped or the network is down.
sketch/sketch.ino: updateAlarmsAndLight()
void updateAlarmsAndLight() {
  if (lastX6.valid) {
    if (lastX6.co_ppm >= CO_ALERT_PPM) coAlarm = true;
    else if (lastX6.co_ppm <= CO_ALERT_CLEAR_PPM) coAlarm = false;
  }
  statusLed.setAlarm(dustAlarm || coAlarm);
  const int score = airScore(lastX6.valid, lastX6.iaq, lastX6.tvoc_ppm, lastX6.hcho_ppm,
                             lastX6.co_ppm, lastDust.valid, lastDust.density_ugm3);
  uint8_t r, g, b;
  scoreColor(score, r, g, b);
  statusLed.setColor(r, g, b);
}
Sending data to Linux
Once per second, the board sends every reading to Linux in a single Bridge.notify call. Every 30 seconds it also sends a short health report with frame counts and sensor status.
sketch/sketch.ino: pushFrame()
Bridge.notify("atmosis_frame",
  (int)FRAME_PROTOCOL, (int)(++frameSeq), (int)(now / 1000UL), statusFlags(),
  lastX6.iaq, lastX6.tvoc_ppm, lastX6.hcho_ppm, lastX6.co_ppm,
  lastX6.temperature_c, lastX6.humidity_pct,
  lastDust.density_ugm3, (int)(lastDust.sensor_v * 1000.0f + 0.5f),
  (int)DUST_ZERO_MV, (int)lastDust.status,
  p.pressure_hpa, p.altitude_m, p.temperature_c,
  pressureChipCode(), (int)loopMaxReported);
The link is intentionally one-way. The board registers no incoming handlers and Linux never sends anything back. Earlier versions that sent LED and heartbeat commands to the board lost the link after a few minutes, and making it one-way removed that problem completely.
Linux Application
On the Linux side, the app registers its Bridge handlers on a separate thread and retries with back-off until the router is ready. Every frame is checked before use: field count, protocol version, NaN or infinite values and gas ranges. Missing sequence numbers show lost frames, and a drop in uptime shows a board restart. If no frame arrives for 3.5 seconds, the dashboard shows the link as offline instead of freezing the last values.
python/atmosis_sources.py: parse_frame() (excerpt)
def parse_frame(params) -> Snapshot:
    p = list(params)
    if len(p) != FRAME_LENGTH:
        raise ValueError(f"frame needs {FRAME_LENGTH} values, got {len(p)}")
    if int(p[0]) != FRAME_PROTOCOL:
        raise ValueError(f"frame protocol {p[0]} is not {FRAME_PROTOCOL} — re-upload the sketch")
    values = [float(v) for v in p[4:11]] + [float(v) for v in p[14:17]]
    if not all(math.isfinite(v) for v in values):
        raise ValueError("frame contained a non-finite value")
    flags = int(p[3])
    ...
For each frame, Atmosis.tick() stores and scores the reading, runs the classifier, and then goes through the decision steps: advisory scheduling, pattern alerts, score alerts, the CO check and the daily report.
Training the Edge Impulse Model
Edge Impulse is used to learn patterns across all nine sensor readings instead of relying only on fixed thresholds. The model is trained on data recorded with the same Atmosis hardware.
Upload the Data Collection Code
Open DataCollection.ino from the Data Collection Code folder on GitHub, select Arduino UNO Q and the correct port, and click Upload. The sketch prints the nine readings as a comma-separated line at 115200 baud.
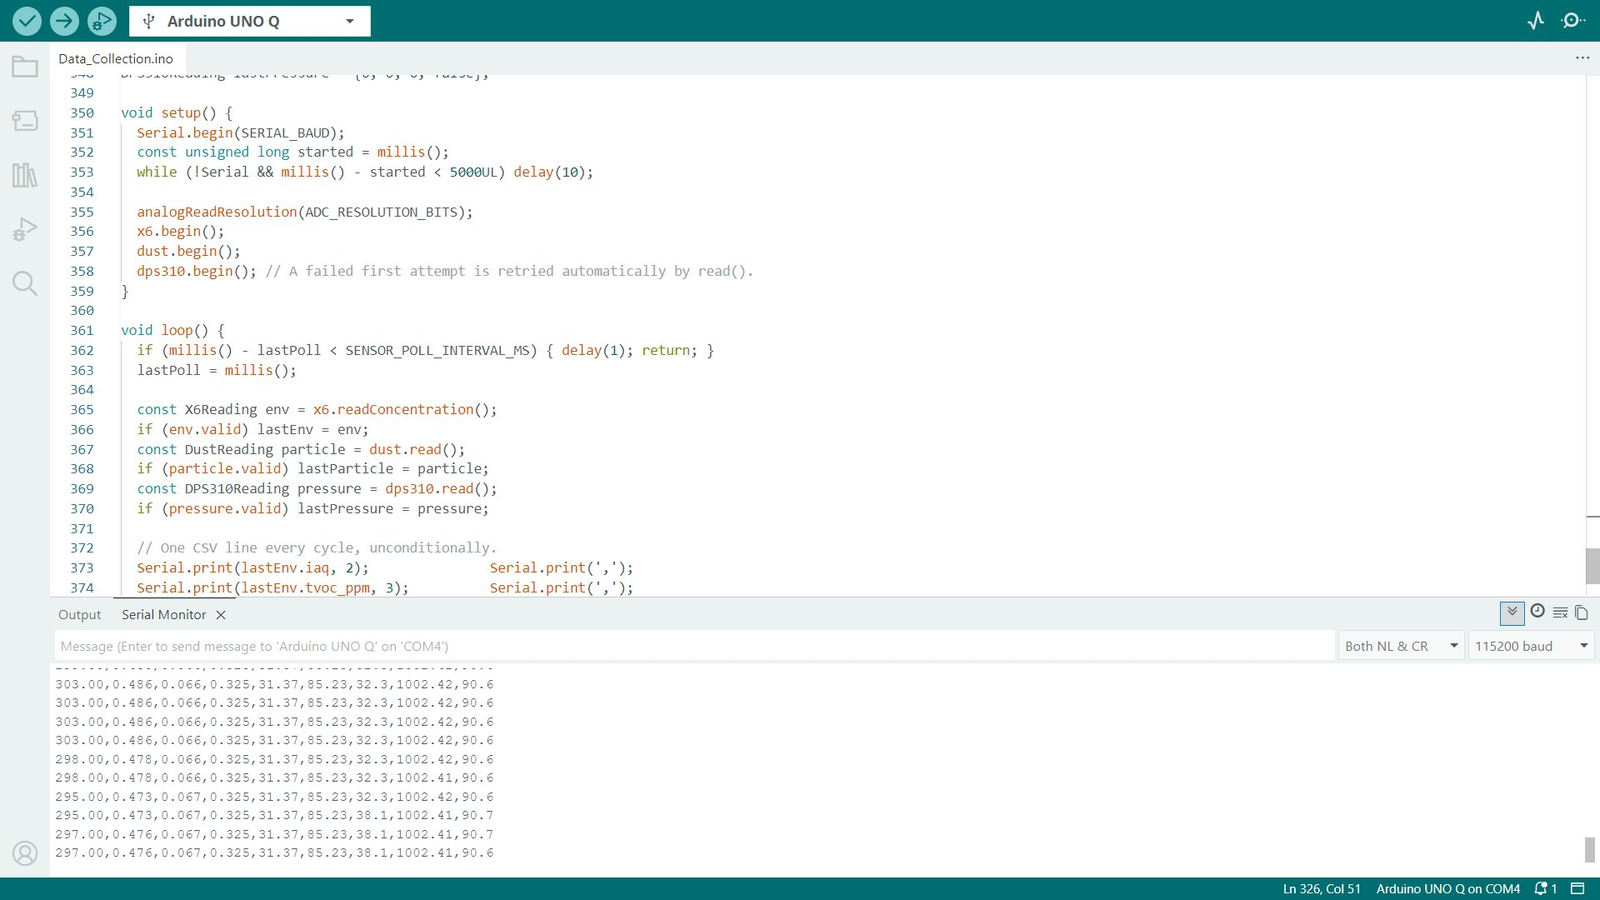
Note: Close the Serial Monitor before starting the Edge Impulse Data Forwarder, since the forwarder needs the serial port.
Create the Edge Impulse Project
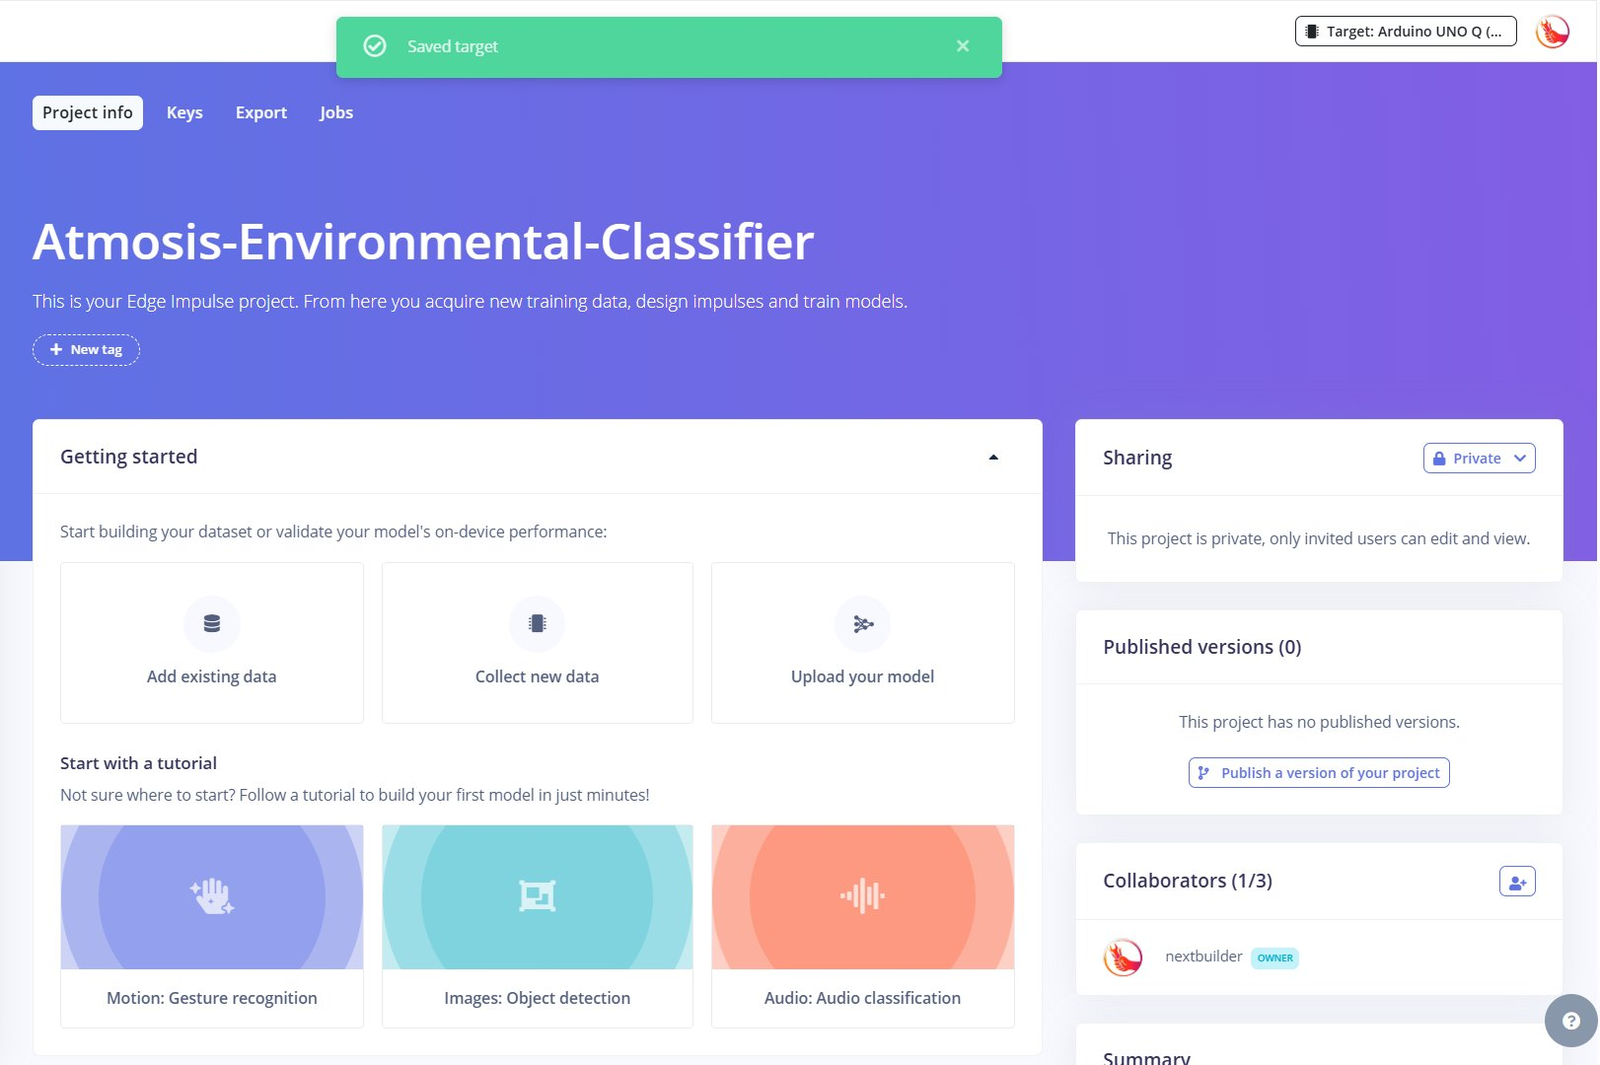
Sign in to Edge Impulse Studio, create a new project called Atmosis-Environmental-Classifier and set the target device to Arduino UNO Q.
Install Node.js and the Edge Impulse CLI
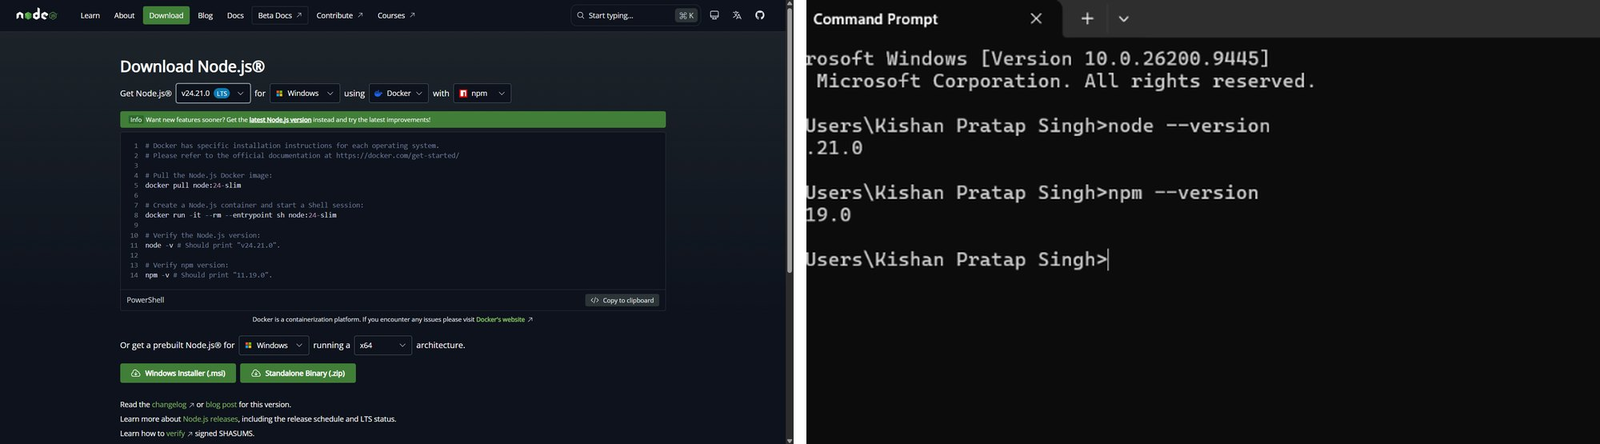
The Edge Impulse CLI needs Node.js. Download the LTS version from nodejs.org, install it with the default options, and check it with node –version and npm –version.
Then install the CLI and check that it works:
Terminal
$ node --version
$ npm --version
$ npm install -g edge-impulse-cli@latest
$ edge-impulse-data-forwarder --version
$ edge-impulse-data-forwarder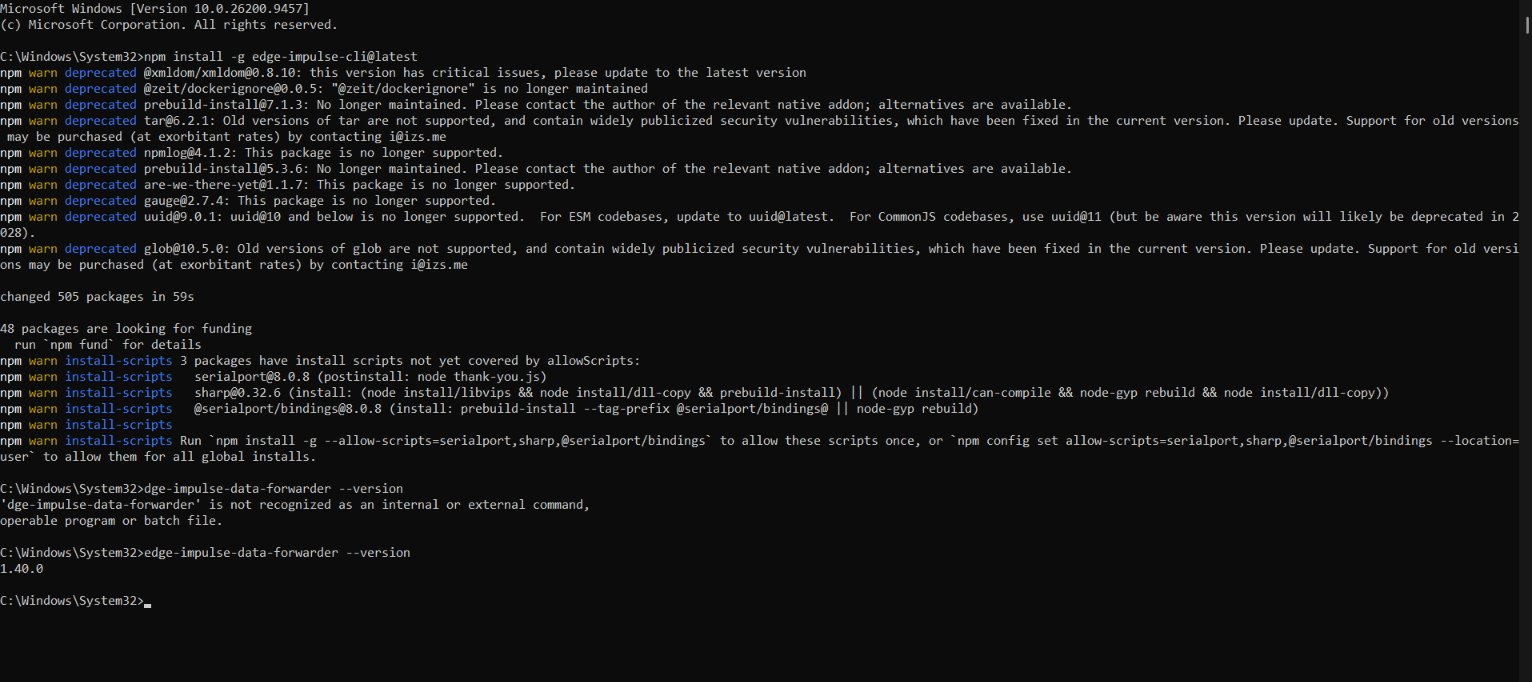
Connect With the Data Forwarder
With the UNO Q connected, run edge-impulse-data-forwarder. It finds the serial port automatically. When asked, enter the axis names in the same order the sketch prints them and name the device AtmosisQ:
Axis names
iaq,tvoc,hcho,co,temp,rh_pct,dust_ugm3,pressure_hpa,altitude_m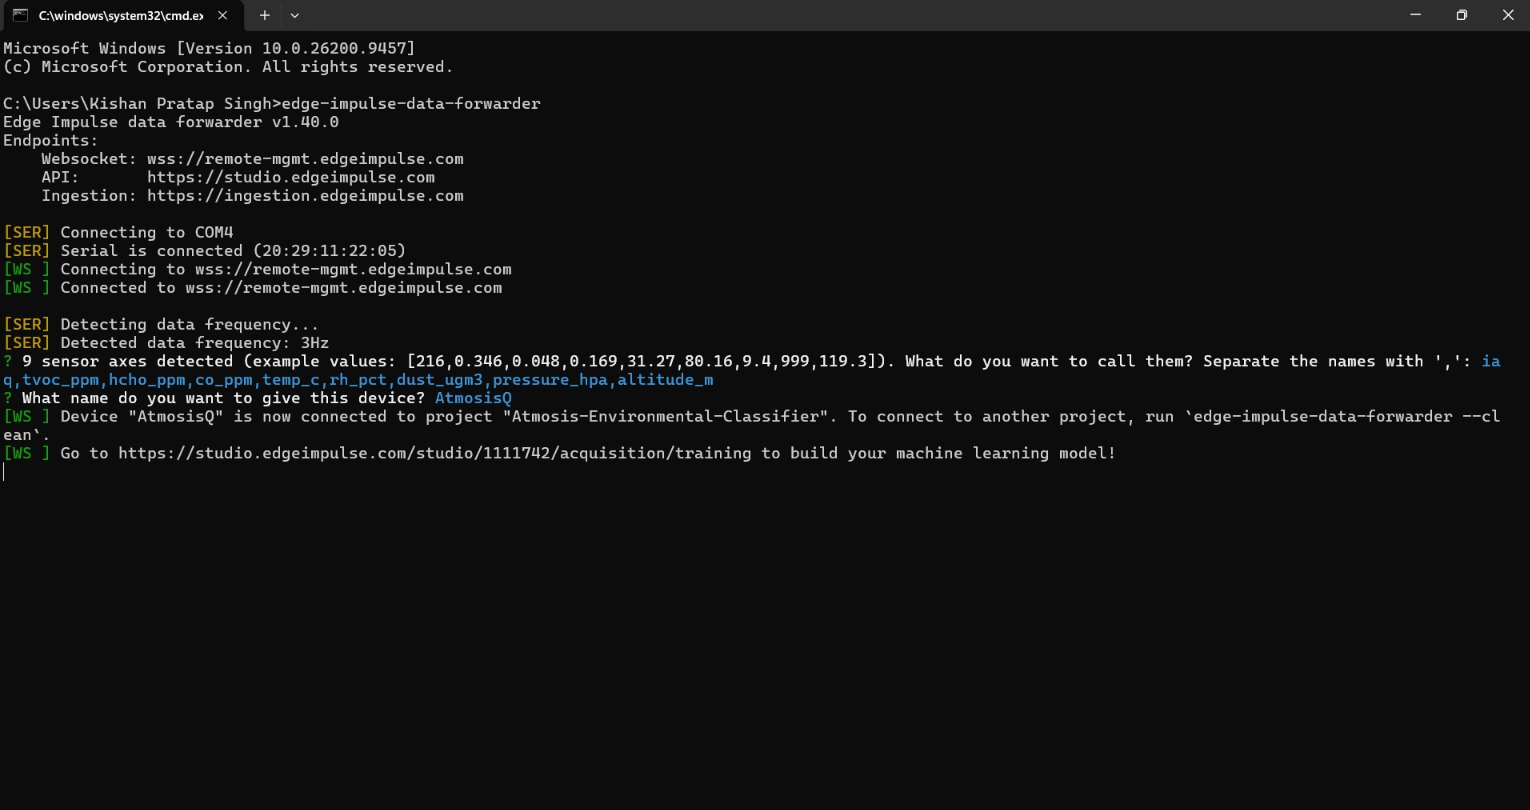
Collect and Label the Data
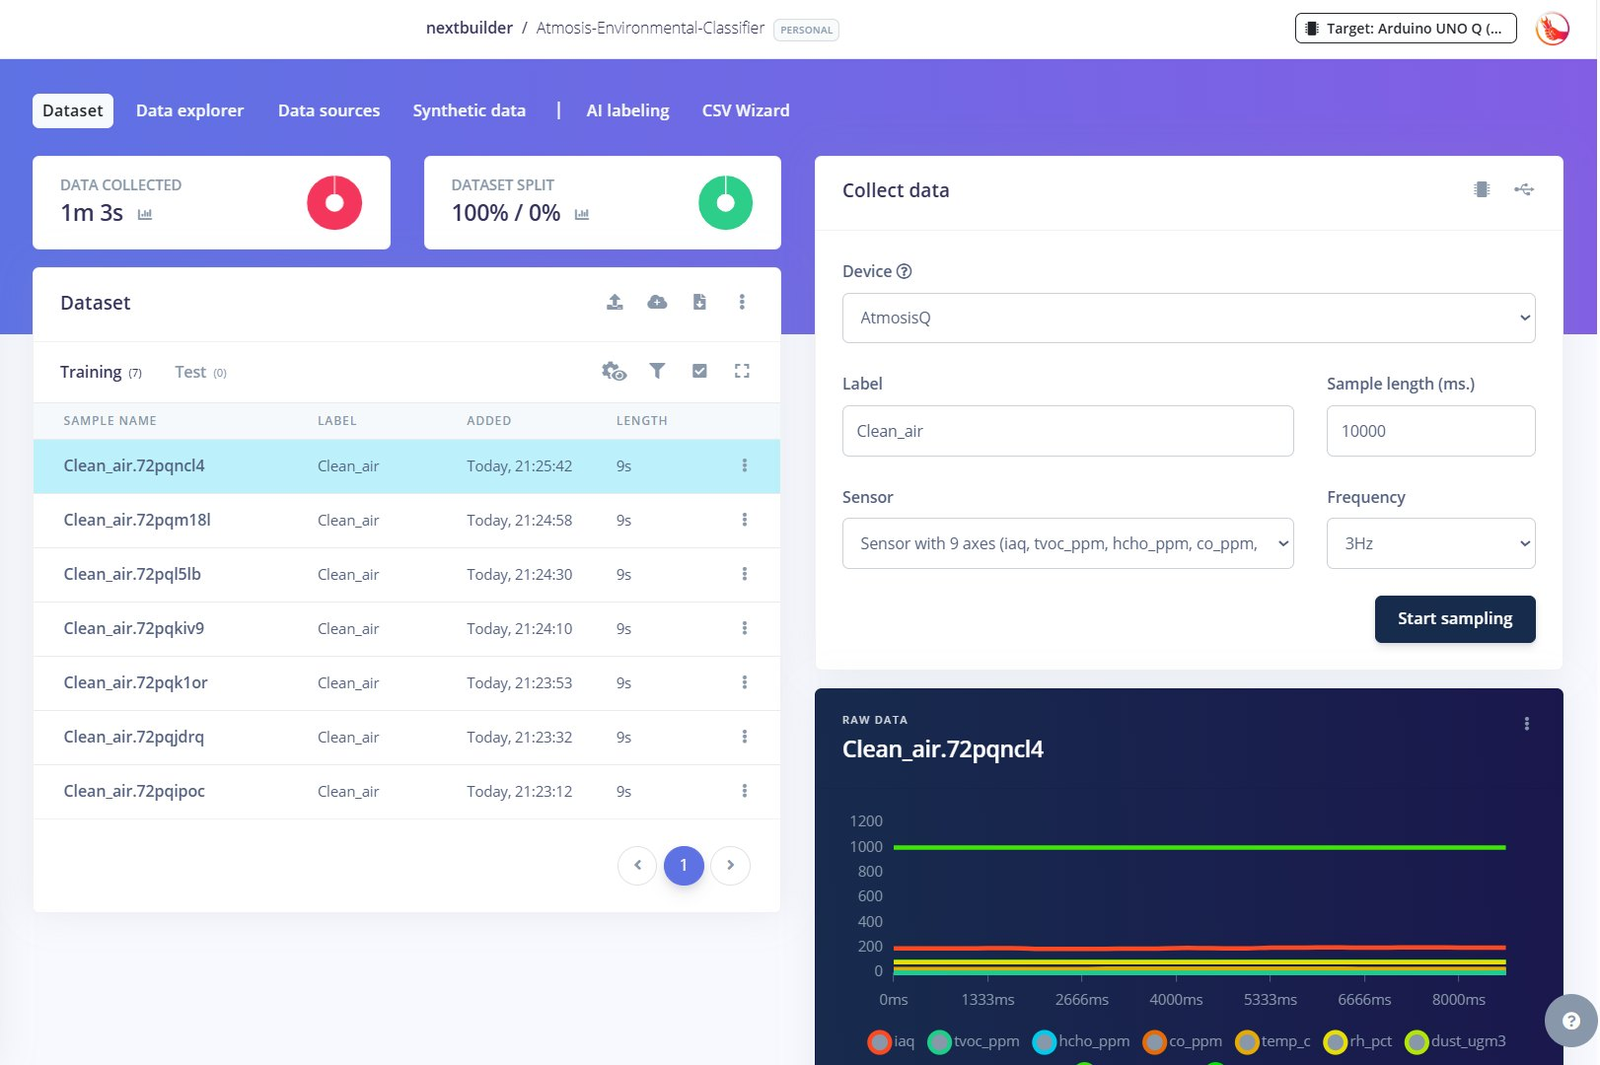
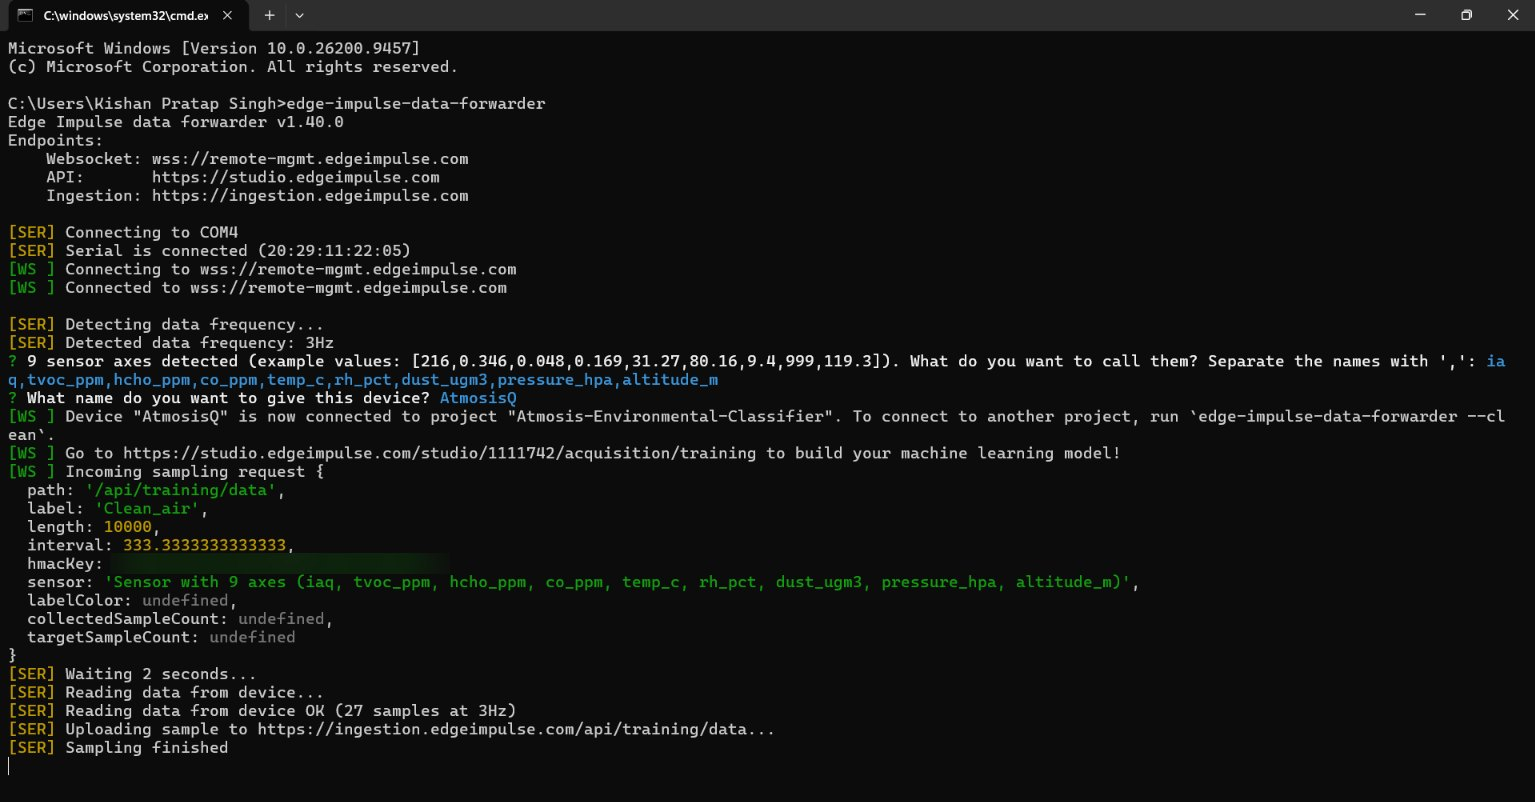
In Data acquisition, select AtmosisQ, keep the sample length at 10,000 ms and the frequency at 3 Hz, enter a label and click Start sampling. I used these labels:
| Label | What it represents |
|---|---|
| Clean_air | Normal indoor air, recorded at different times and places |
| Traffic_pollution | Near a busy road, recorded briefly |
| Construction_dust | A real dusty or construction site, when safely available |
| Indoor_pollution | Short household sources such as cooking or incense |
| Poor_ventilation | A closed room where the air slowly changes |
| Biomass_burning | Only when it happens naturally and safely |
| Unusual_event | Real anomalies that don’t fit the other classes |
Record many separate sessions for each label instead of repeating the same one, and always use the label that really describes the air. Never create smoke, fire or dust just to collect data.
Create the Impulse
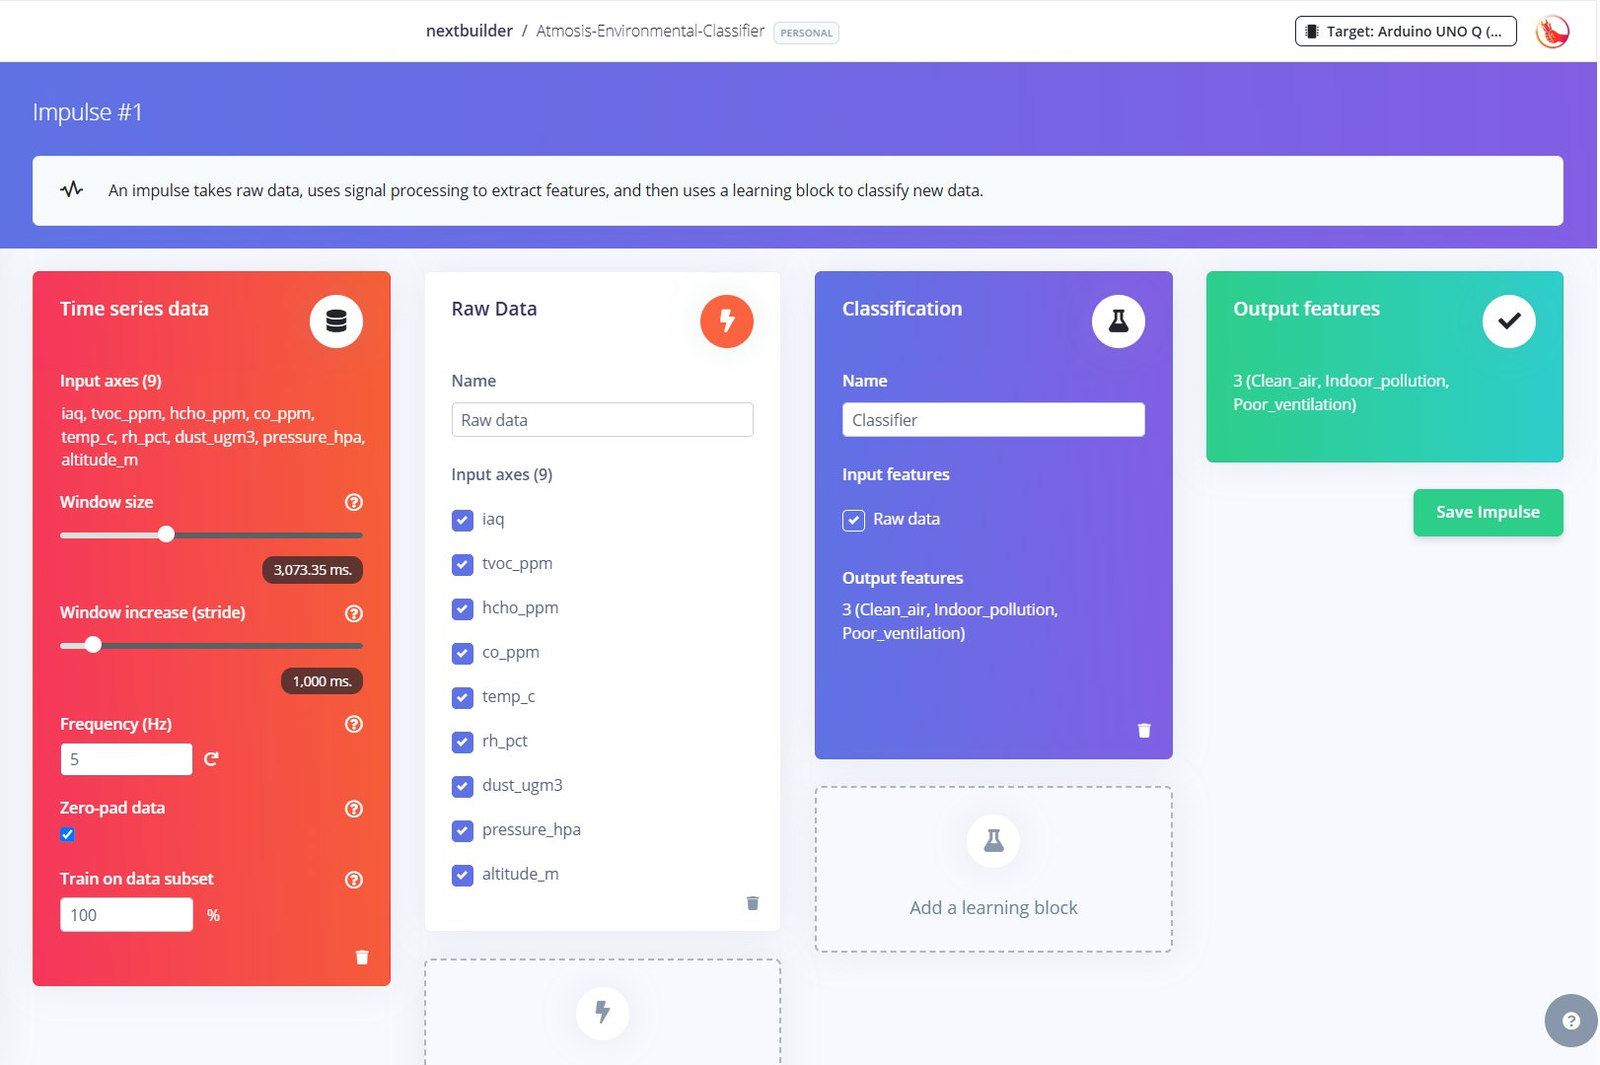
In Impulse design → Create impulse, keep all nine axes, set the window size to 3,000 ms, the window increase to 1,000 ms and the frequency to 5 Hz. Add Raw Data as the processing block and Classification as the learning block, then click Save Impulse.
Generate Features
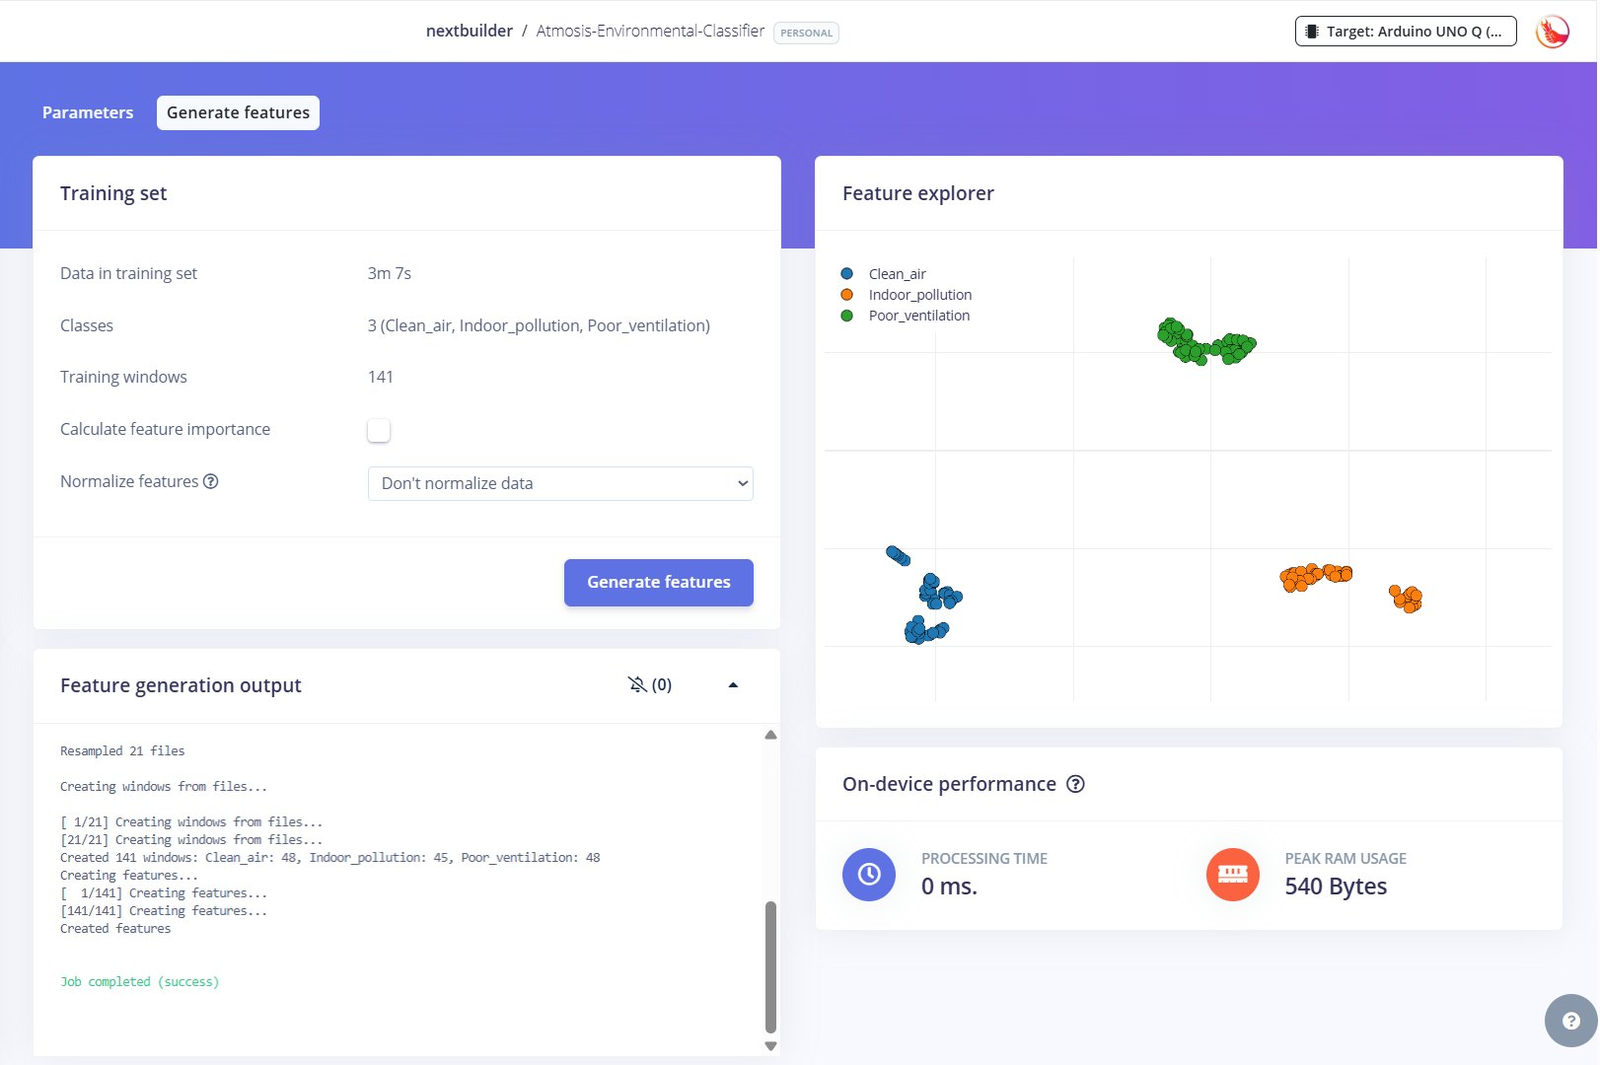
In Raw data, keep the scale at 1, save the parameters, and click Generate features with normalisation turned off. The current dataset gives 141 training windows across Clean_air, Indoor_pollution and Poor_ventilation, and the feature explorer shows three clear clusters.
Train the Model
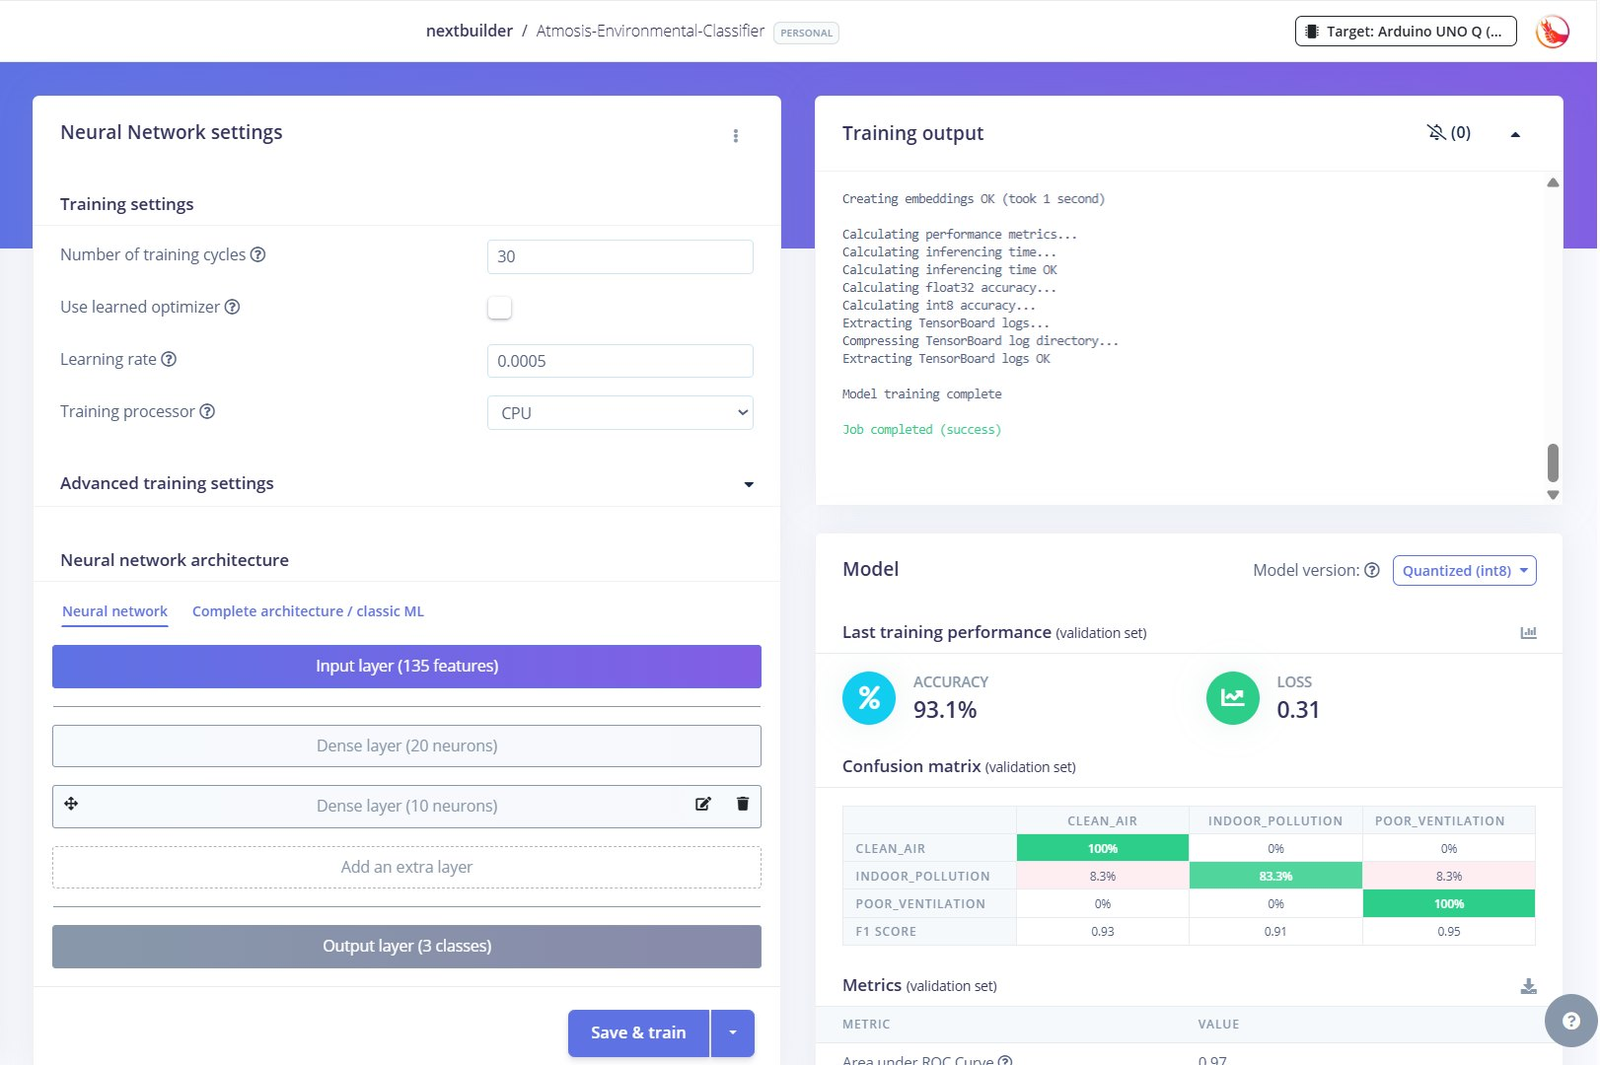
In Classifier, I kept the default settings: 30 training cycles, a learning rate of 0.0005 and CPU training. The network has 135 inputs, two dense layers of 20 and 10 neurons, and an output for each class.
The current model reached 93.1% validation accuracy with a loss of 0.31. In the confusion matrix, Clean_air and Poor_ventilation were classified correctly every time and Indoor_pollution 83.3% of the time, with F1 scores of 0.93, 0.91 and 0.95. Adding more samples for each condition will help it generalise further.
Deploy the Model
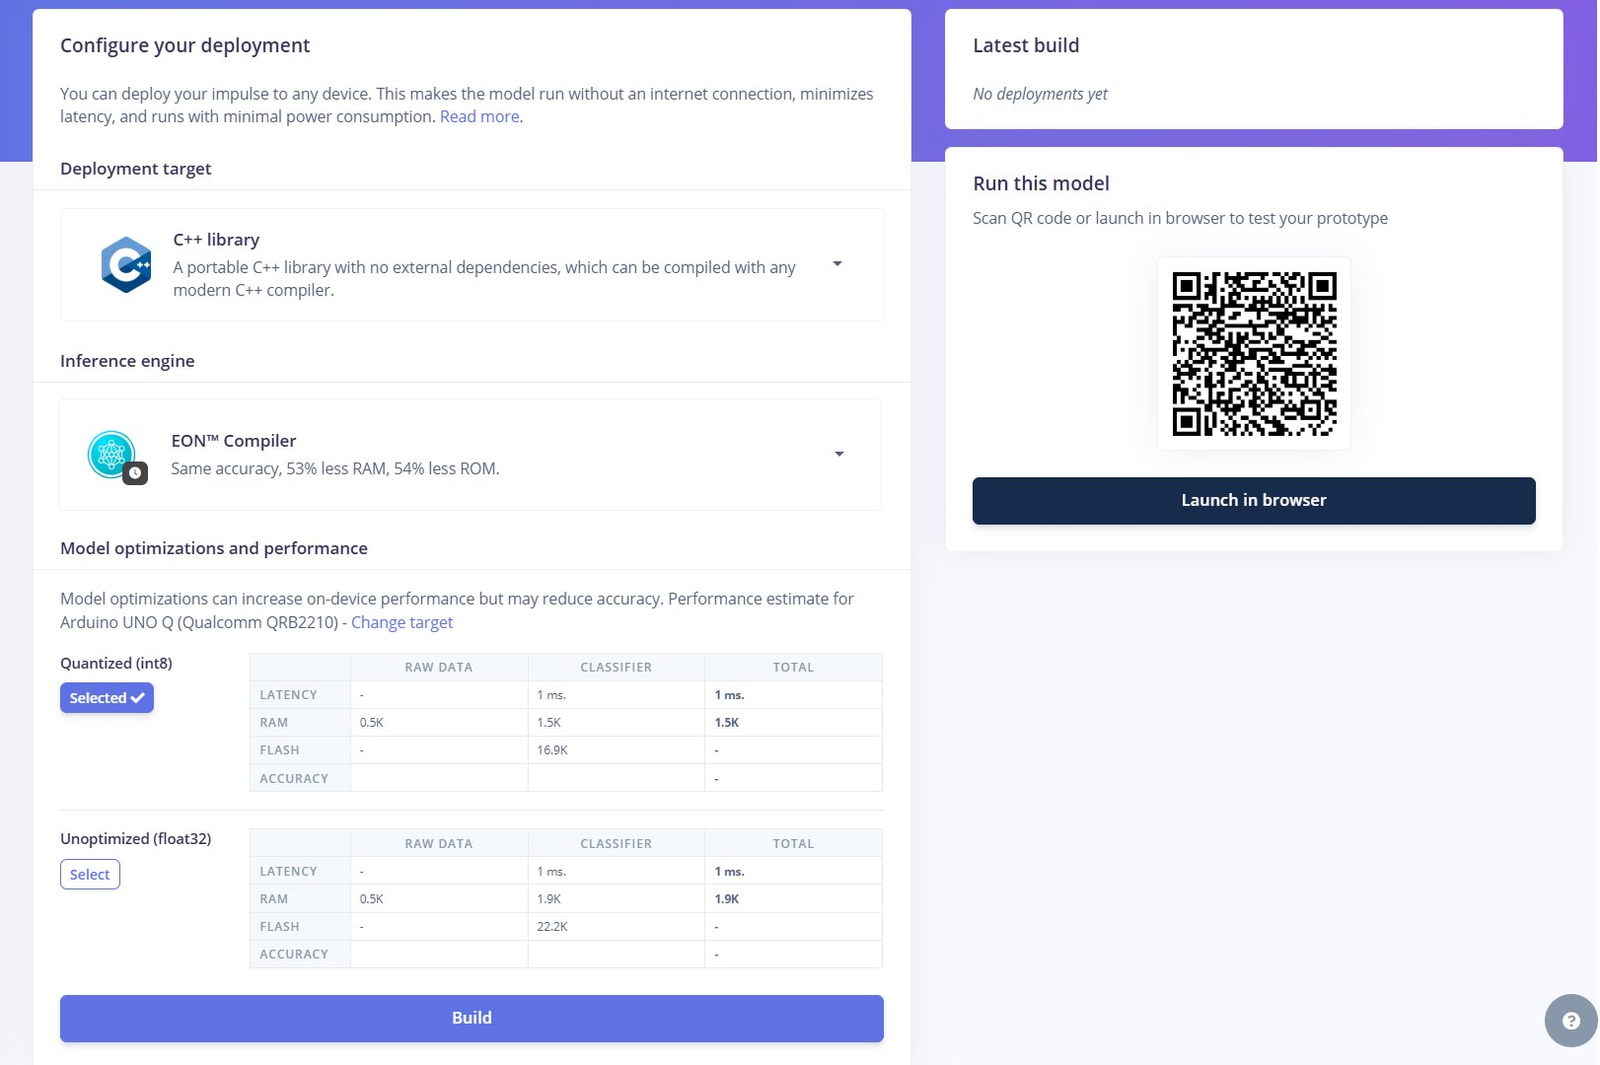
In Deployment, choose C++ library, keep the EON Compiler and Quantized (int8) selected, check that the target is Arduino UNO Q, and click Build.
Running the Model on the UNO Q
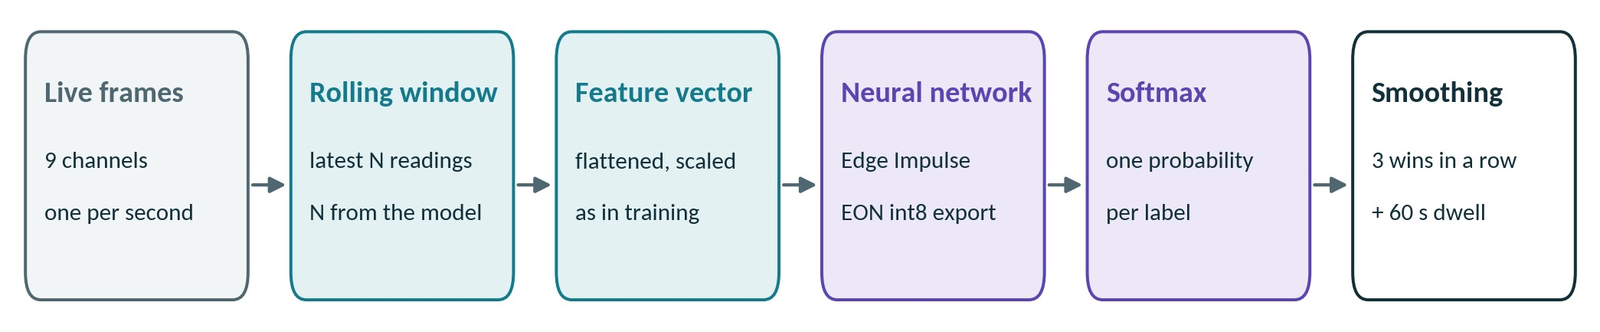
Instead of compiling the C++ library, atmosis_ei.py reads the exported model files directly and runs the network in plain Python. It takes the axis order, window size, labels and int8 weights from the export itself, so a retrained model can be dropped into python/model/ without code changes. It also refuses a model whose axis order doesn’t match the app.
python/atmosis_ei.py
def forward(self, x):
    for layer in self._layers:
        if layer["type"] == "dense":
            act = layer["act"]
            x = [_activate(sum(w * v for w, v in zip(row, x)) + b, act)
                 for row, b in zip(layer["w"], layer["b"])]
        elif layer["type"] == "softmax":
            m = max(x)
            e = [math.exp(v - m) for v in x]
            s = sum(e)
            x = [v / s for v in e]
    return x

def classify(self, features):
    if len(features) != self.feature_count:
        raise AtmosisInferenceError(f"expected {self.feature_count} features, got {len(features)}")
    probs = self.forward(self.prepare(features))
    best = max(range(len(probs)), key=lambda i: probs[i])
    return Classification(label=self.labels[best], confidence=probs[best], ...)
A single window can be noisy, so a new label is accepted only after it wins three windows in a row, and it must hold for 60 seconds before an alert goes out. Pattern alerts are sent at most once every 30 minutes. At startup the model is checked against four reference situations; if it’s missing or fails the check, Atmosis falls back to a threshold-based pattern engine.
Gemini Advisor and Telegram Alerts
Get a Gemini API Key
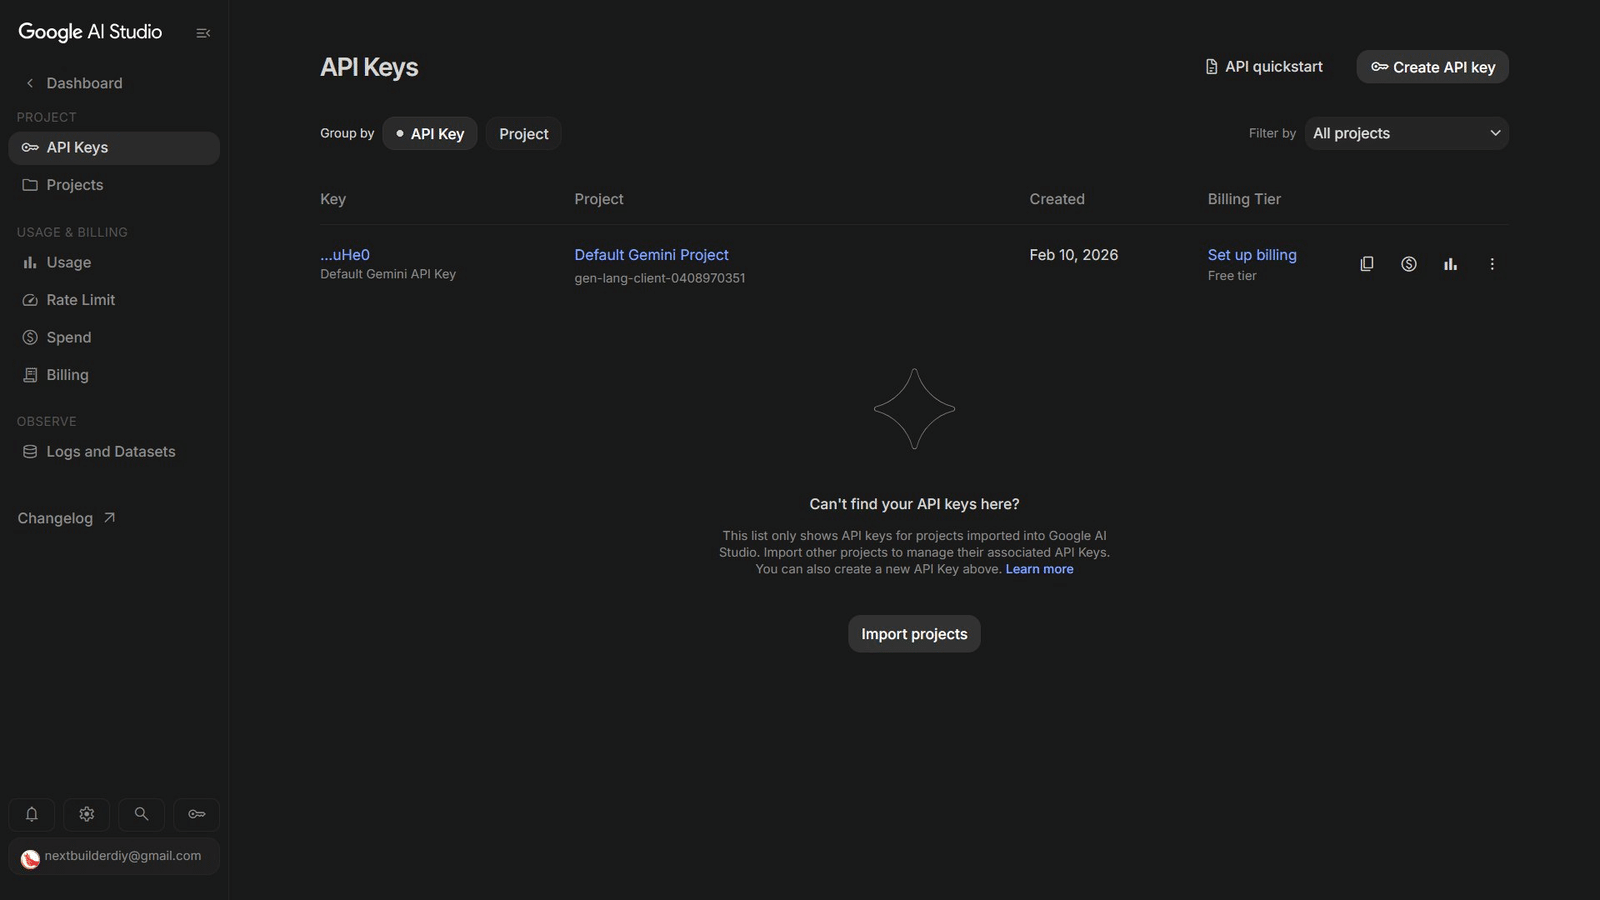
Open Google AI Studio, sign in with your Google account, go to API Keys → Create API key and copy the key.
How the Advisor Works
Gemini is only called when the advice is useful: when the score drops below 60, a CO or dust alarm is active, or Edge Impulse detects pollution or poor ventilation. New advice is written when attention is first needed, refreshed if the air moves into a worse band (at most every 5 minutes), and otherwise refreshed after 30 minutes. When the air is healthy, no request is made.
python/main.py: _schedule_advisory() (excerpt)
rank  = BAND_RANK[score_band(score, True)]
first = self._advised_rank is None
worse = (not first and rank > self._advised_rank
         and (now - self._adv_at) >= self.cfg.AI_ESCALATE_GAP_S)
stale = not first and (now - self._adv_at) >= self.cfg.AI_AUTO_INTERVAL_S
if first or worse or stale:
    self._advised_rank = rank
    self._adv_at = now
    self.advisory["pending"] = True
    ctx = self.advisory_context()
    ctx["previous"] = self.advisory["text"] if not first else ""
    self._submit("advisory", ctx)
The prompt includes the score, the live readings, the detected pattern, the user’s sensitivity setting and the previous advice, with an instruction not to repeat it. A reply that is more than 85% similar to the current advice isn’t shown as new.
python/ai_advisor.py
SYSTEM_PROMPT = (
    "You are Atmosis, the calm indoor-air advisor inside a home "
    "air-quality monitor in India. "
    "Speak plainly to a non-expert. Use only the live readings given. "
    "Reply in 2 to 4 short sentences, then one line that starts with "
    "'Do this:' giving one practical action. No markdown, "
    "no lists, no diagnosis, no mention of medical conditions."
)
Requests go to the Gemini generateContent endpoint with a fixed time budget. Temporary errors are retried, and after a failure the advisor backs off for 30 seconds, then 1, 2 and up to 5 minutes. Questions asked from the dashboard while Gemini is busy are queued and answered as soon as it responds.
Create a Telegram Bot
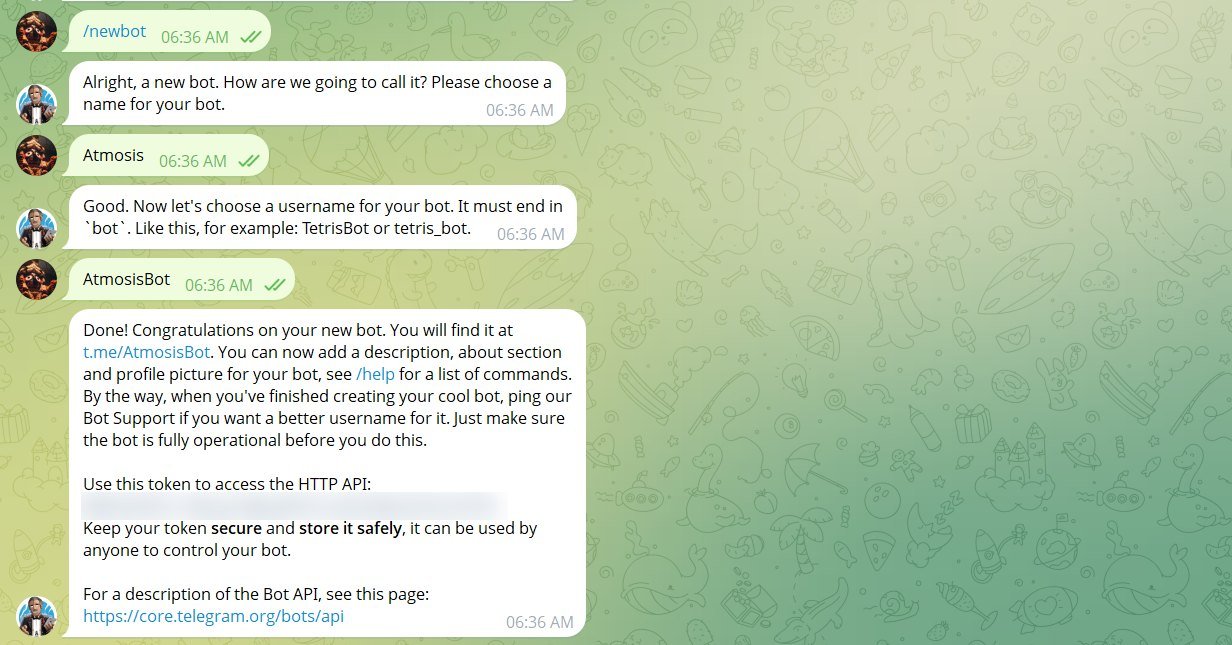
Open @BotFather in Telegram and send /newbot. I named the bot Atmosis with the username AtmosisBot. BotFather then gives you an HTTP API token; keep it private.
Get the Telegram Chat ID
Send your bot a message such as “Hi”, then open the following URL in a browser with your own token. The number next to id inside chat is your chat ID.
Browser
https://api.telegram.org/botYOUR_BOT_TOKEN/getUpdates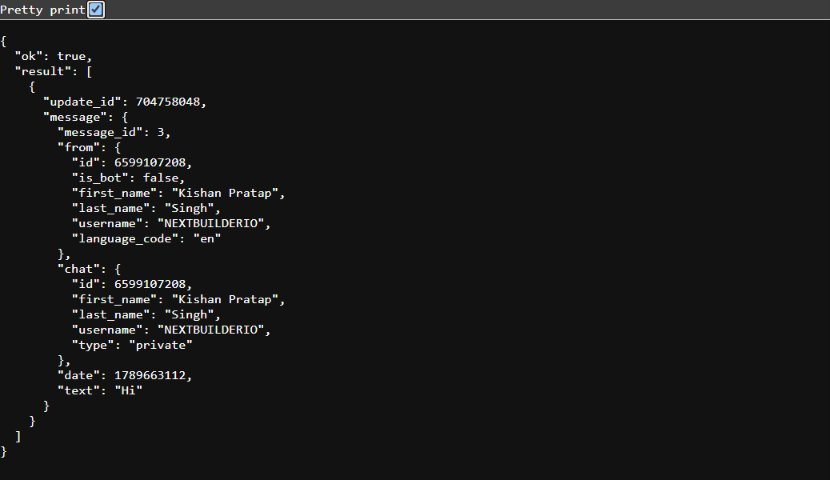
Telegram Alerts
Each alert is sent as a Telegram HTML card with a headline, a score bar, the air-quality and climate readings, one clear action and a short Gemini tip. If Telegram rejects the formatting, the message is sent again as plain text so the alert still arrives. Messages are spaced at least 1.1 seconds apart to respect Telegram’s limits.
python/atmosis_notify.py: Telegram.send() (excerpt)
payload = {"chat_id": self.cfg.TELEGRAM_CHAT_ID, "text": text, "parse_mode": "HTML",
           "link_preview_options": {"is_disabled": True}}
resp = self._post(payload)
if resp.status_code == 400 and "parse" in resp.text.lower():
    resp = self._post({"chat_id": self.cfg.TELEGRAM_CHAT_ID, "text": strip_html(text)})
Arduino App Lab and Dashboard
Import, Configure and Run
- Download the repository from GitHub and open the Arduino App Lab folder.
- In Arduino App Lab, choose Import App and select the Atmosis project. App Lab sets up the firmware, the Python app and the configuration.
- Add your credentials to python/.env (use .env.example as the template). config.py reads them at startup, and leaving a key empty simply turns that feature off.
- Click Run and open http://localhost:7000 in a browser.
| Setting | Purpose |
|---|---|
| GEMINI_API_KEY | Google AI Studio key for the advisor |
| GEMINI_MODEL | Gemini model, gemini-3.5-flash by default |
| TELEGRAM_BOT_TOKEN | Bot token from @BotFather |
| TELEGRAM_CHAT_ID | Your Telegram chat ID |
Dashboard
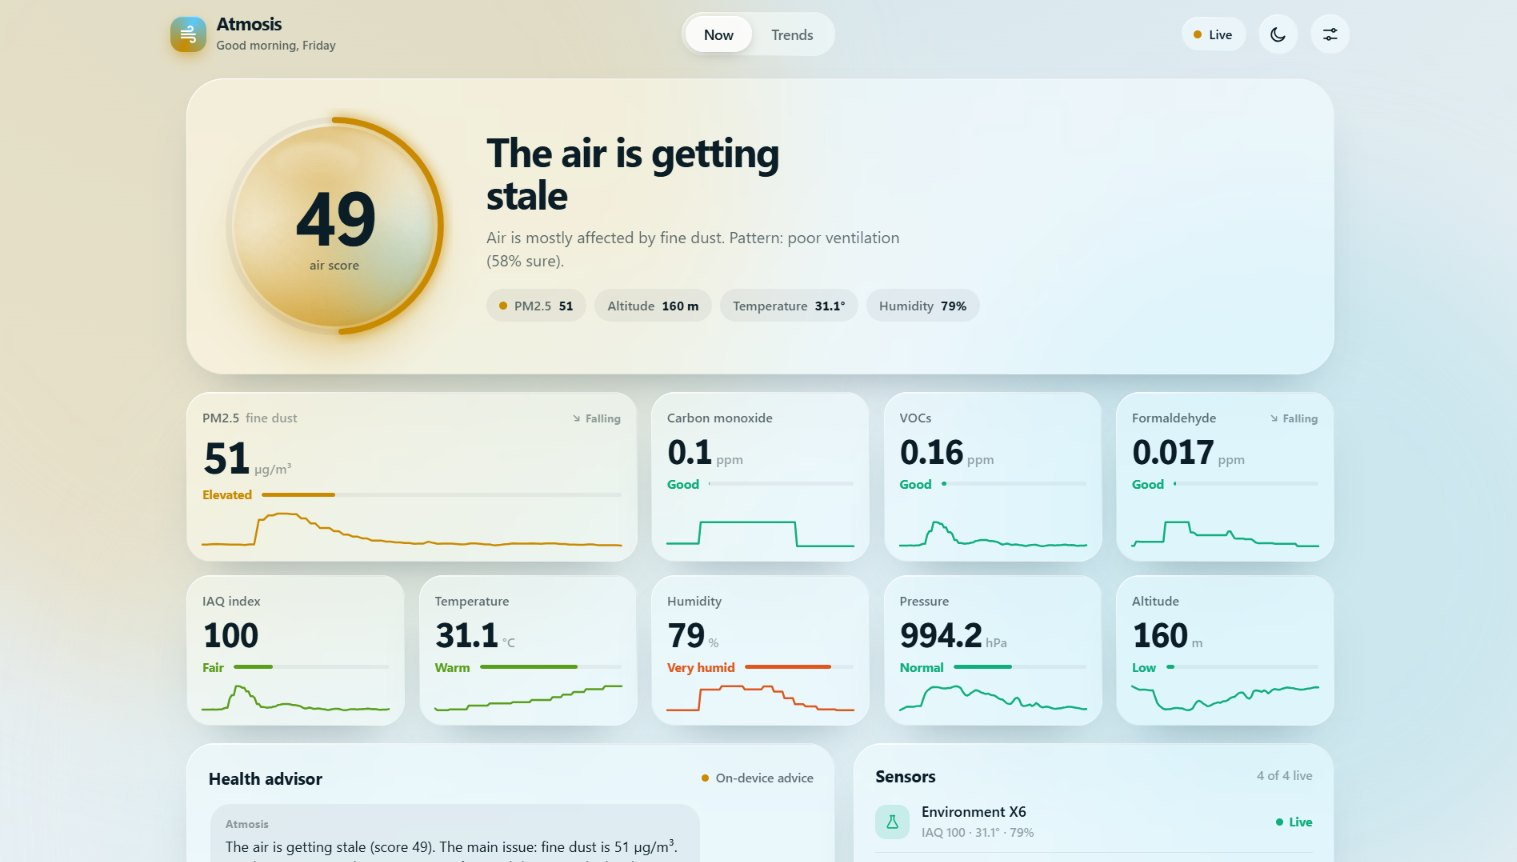
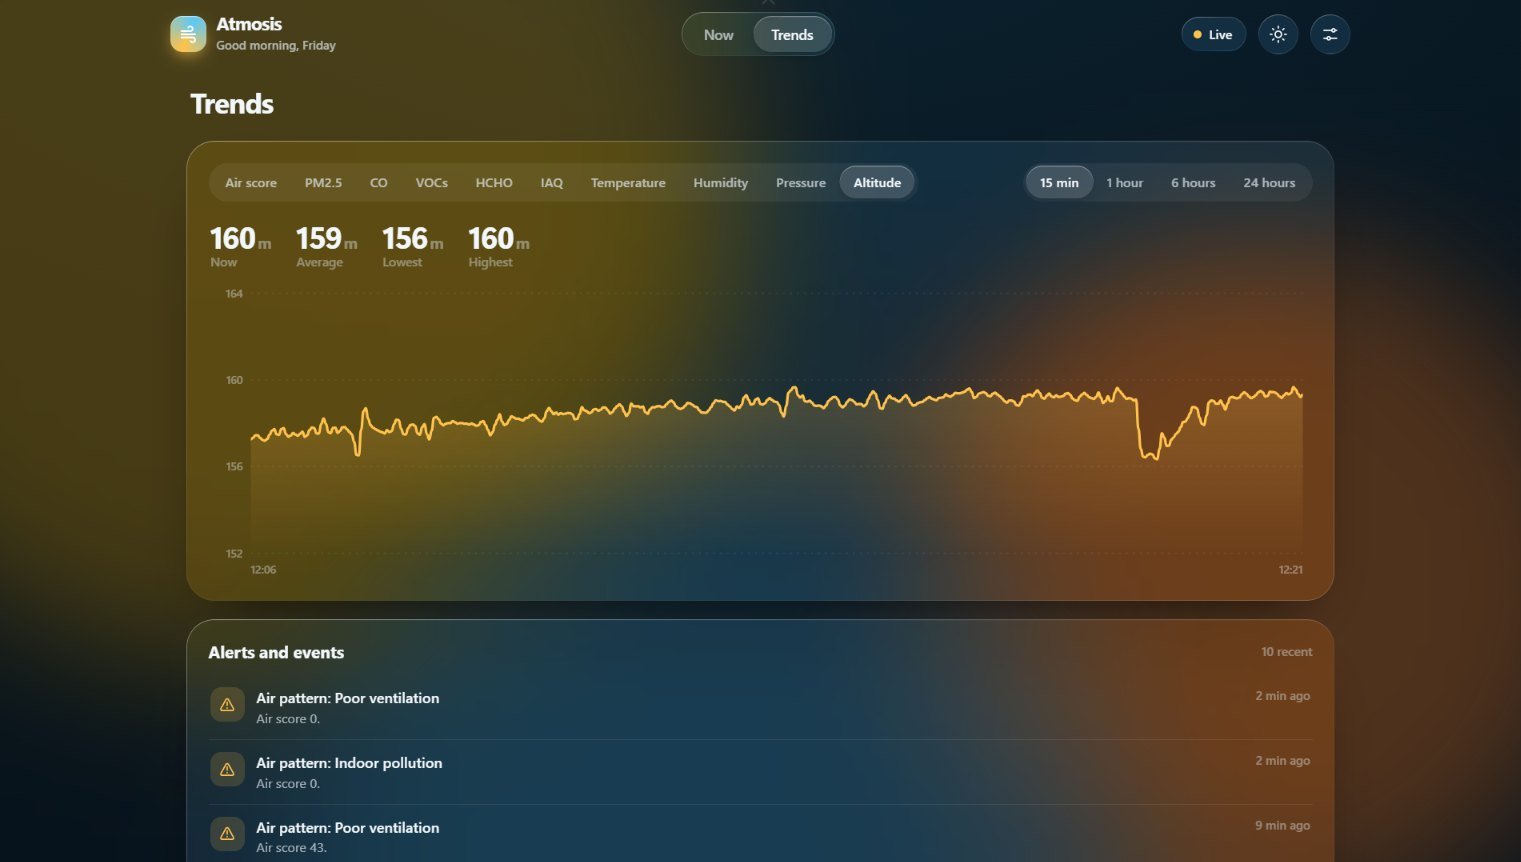
A Flask server on port 7000 serves the dashboard and a small JSON API. The dashboard is a single HTML file with an iOS-inspired design and light and dark themes. It updates every second and shows the air score, all nine readings with trends, the detected air pattern, sensor status and the Gemini advisor, where you can also ask questions about the current conditions. The Trends tab shows the history of every reading along with recent alerts.
Testing
I tested each part of the system separately before testing it as a whole. The firmware logic (sensor drivers, air score, dust conversion, altitude and alarm hysteresis) is checked on a PC with a simulator, and the firmware is cross-compiled for the STM32U585 to catch build problems early. On the Linux side, 64 automated tests cover frame parsing, air-score agreement with the firmware, the Edge Impulse loader, smoothing, advisor scheduling and Telegram formatting.
On the device itself, these checks confirm that everything is working:
- After clicking Run, the dashboard shows all sensors as live and the readings update every second.
- The LED strip shows the air-score colour and changes smoothly.
- A short, safe indoor source such as an incense stick raises PM2.5 and lowers the score. At 150 µg/m³ the strip pulses red, and it clears below 130 µg/m³.
- Keeping the room closed for a while changes the air pattern to Poor_ventilation after the smoothing delay.
- When the score drops below 60, the Gemini advice appears on the dashboard and an alert arrives on Telegram.
- With the Internet disconnected, the light, alarms and dashboard keep working; only Gemini and Telegram pause.
Note: Never produce carbon monoxide to test the CO alarm. Its thresholds are covered by the firmware tests.
Final Thoughts
Building Atmosis was mostly about turning raw measurements into a reliable decision. The STM32U585 handles the time-critical processing and safety logic, the Linux side adds history, event handling and machine learning, Edge Impulse recognises patterns over time, and Gemini explains the result in plain language.
So instead of only asking “What is the value?”, Atmosis asks “What is changing, what does it mean, and does it need a response?” That is what Atmosis means to me: not just environmental monitoring, but environmental intelligence.
