


Obtaining sensor data wirelessly and with minimal wiring is a significant application of IoT. This system is useful for monitoring people, machines, environments, and soil wirelessly.
Often, a web server and dashboard are required to display real-time data for tracking purposes. In many systems, connecting data to cloud services and web servers is essential for streaming data and obtaining customisable dashboards.
However, the IndusBoard and all ESP32 chips have the capability to host a webpage in a compact space, eliminating the need for extensive wiring and external sensor purchases.
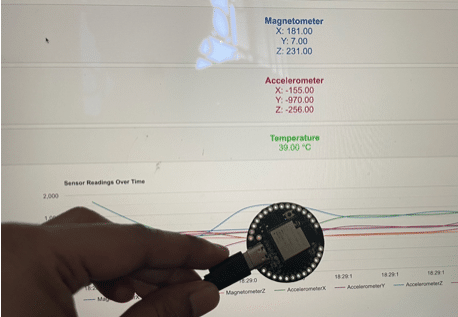
Simply upload the code, and you’re ready to interact with the IoT dashboard. The only component needed is the IndusBoard, as it already includes 3D magnetic, 3D accelerometer sensors, and a temperature sensor.
Coding for IoT Dashboard
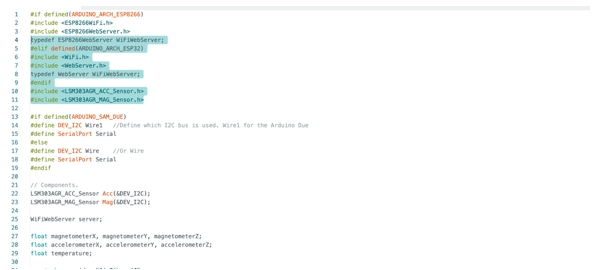
First, install the necessary libraries for the sensor and webserver in the Arduino IDE. The library names are highlighted in the code snippet below.
Configure the Wi-Fi network in the code, enable the sensors to collect data, and then create the setup function to connect the device to the configured Wi-Fi.
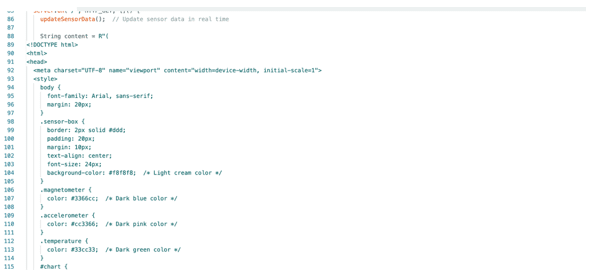
Next, design the webpage using HTML, CSS, and JavaScript to display graphs and sensor data. Google Graphs API is used here to show the graphs.
In the setup function, update the sensor data and send it to the WebSocket to update the sensor data on the webpage.
You can customize the webpage layout, add more cards and functions for displaying sensor data, and even upload sensor data with timestamps to a CSV or text file.
Save the file on the cloud, SD card, or the board itself, as it has 1MB of SPIFFS memory for storage.
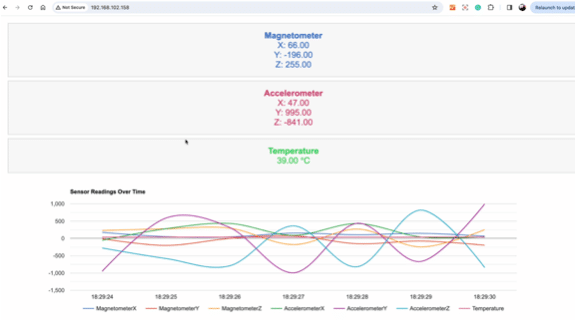
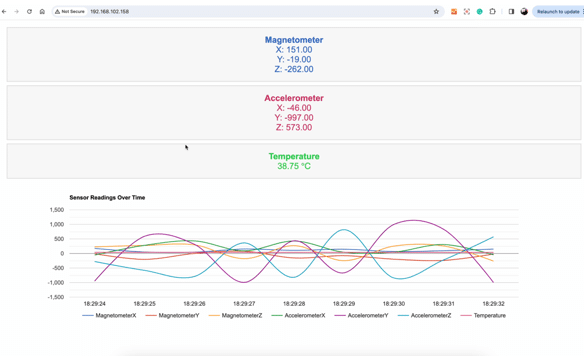
Now, select the board and upload the code. You will be able to observe the sensor data.
In the code, you can customize the webpage layout by adding more cards and functions to display sensor data as per your requirements.
Additionally, you can configure the system to log sensor data with timestamps and save it in a CSV or text file. This data can be stored on a cloud server, an SD card, or even directly on the IndusBoard, thanks to its built-in 1MB of SPI flash memory.
Now select the board and upload the code and you can see the senor data there.
Download Source Code
Testing
Upload the code and open the serial monitor. Note the IP address, copy it into the browser, and you can view the sensor data on the webpage.
Hi Ashwini,
I am getting below error, can you help please !!!
WARNING: library STM32duino LSM303AGR claims to run on stm32, avr, sam architecture(s) and may be incompatible with your current board which runs on esp32 architecture(s).
In file included from C:\Users\Arduino\libraries\STM32duino_LSM303AGR\src/LSM303AGR_ACC_Sensor.h:48,
from C:\Users\\Arduino\sensordataiot\sensordataiot.ino:10:
C:\Users\Arduino\libraries\STM32duino_LSM303AGR\src/LSM303AGR_ACC_Driver.h:58:22: error: conflicting declaration ‘typedef unsigned int u32_t’
58 | typedef unsigned int u32_t;
| ^~~~~
In file included from C:\Users\Arduino15\packages\esp32\tools\esp32-arduino-libs\idf-release_v5.1-632e0c2a\esp32s2/include/lwip/lwip/src/include/lwip/debug.h:40,
from C:\Users\Arduino15\packages\esp32\tools\esp32-arduino-libs\idf-release_v5.1-632e0c2a\esp32s2/include/lwip/lwip/src/include/lwip/opt.h:52,
from C:\Users\Arduino15\packages\esp32\tools\esp32-arduino-libs\idf-release_v5.1-632e0c2a\esp32s2/include/lwip/lwip/src/include/lwip/ip_addr.h:40,
from C:\Users\Arduino15\packages\esp32\hardware\esp32\3.0.7\cores\esp32/IPAddress.h:25,
from C:\Users\Arduino15\packages\esp32\hardware\esp32\3.0.7\cores\esp32/Arduino.h:196,
from C:\Users\arduino\sketches\44F53E3BEA4A76CE8E29CC05F83835F8\sketch\sensordataiot.ino.cpp:1:
C:\Users\Arduino15\packages\esp32\tools\esp32-arduino-libs\idf-release_v5.1-632e0c2a\esp32s2/include/lwip/lwip/src/include/lwip/arch.h:129:19: note: previous declaration as ‘typedef uint32_t u32_t’
129 | typedef uint32_t u32_t;
| ^~~~~
exit status 1
Compilation error: exit status 1
Downgrade the the ESP32 baord to 2.0.17 . Go the Board manager and then search the esp32 and then select the version 3.0 ay version below 2…. will work