 An Android phone allows itself to be locked/unlocked using a password, pattern on a grid of nine dots, fingerprint or facial recognition. An Android phone using a password needs a sequence of four digits or numbers to unlock the screen. This article describes the design, testing and working of the smartphone screen lock/unlock application using Simulink and Stateflow toolboxes of MATLAB R2014a software.
Working
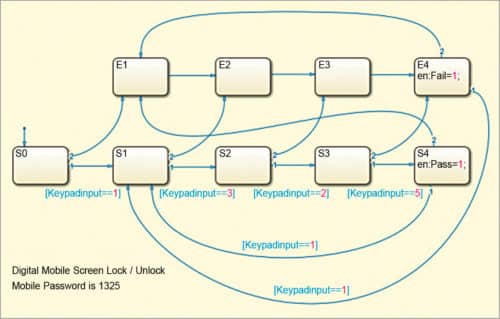
The design of the phone screen lock/unlock application, as given in Fig. 3, contains paths S and E for the password (1 3 2 5). Path S is S0→S1→S2→S3→S4, whereas path E is E1→E2→E3→E4. All Android phones can be unlocked by entering the four magic digits set as password by users.
The screen lock/unlock application is designed in such a way that a correct four-digit password entered by the user chooses path S (S0→S1→S2→S3→S4) to unlock the phone. However, entering a wrong password causes the transition jump from path S to path E, leading to the failure of the password and the screen to remain locked.

When a wrong password is entered, the phone remains locked. Some examples are given below:
- For password 9 3 2 5, the phone takes path S0→E1→E2 →E3→E4 and remains locked.
- For password 1 4 2 5, the phone takes path S0→ S1→E2→E3→E4 and remains locked.
- For password 1 3 5 5, the phone takes path S0→ S1→S2→E3→E4 and remains locked.
- For password 1 3 2 1, the phone takes path S0→ S1→S2→S3→E4 and remains locked.
The phone screen lock application presented here can also be used in other places where four-digit authentication is required, for, say, unlocking a digital door lock, drawing cash from an ATM machine and so on.
Modelling simulation
Steps for creating the phone screen lock application using MATLAB software are given below.
- Open MATLAB software and enter simulink command to open Simulink Library Browser.
- Open a new blank model for creating the screen lock application by selecting File→New→Model from Simulink Library Browser.
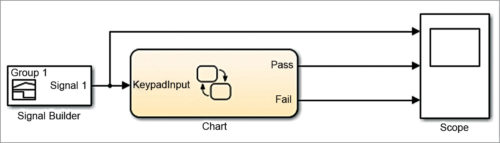
- Take three blocks—Signal Builder, Chart and Scope—as shown in Fig. 1 from Simulink Library Browser to build the model. First, click on Simulink toolbox in Simulink Library Browser and then Sources library to select Signal Builder block. Then, take Scope block from Sinks library in Simulink toolbox. Last, take Chart block from Stateflow toolbox.
- Pick, drag and place the three blocks—Signal Builder, Chart and Scope—from Simulink Library Browser into Model.
- Double-click on the chart to open the internal structure or state machine of the simulation. A new window will open, as shown in Fig. 3. States and transitions are the key graphical elements used for building the logic of the screen lock application inside the chart.
- Graphical elements (states, transitions, etc) needed to create the logics are available on Object Palette inside the chart.
- Create the logic inside the chart using the states and drawing transitions, as given in Fig. 3. Right-click anywhere inside the chart, select Properties option. Next, choose Update Method as Discrete, and enter Sample Time as 1.
- After creating the logic, select View→Model Explorer from the menu to add input and output to the chart.
- In Model Explorer window, click on Add menu and select Data to add input (KeypadInput) and two output variables (Pass and Fail) to the chart.
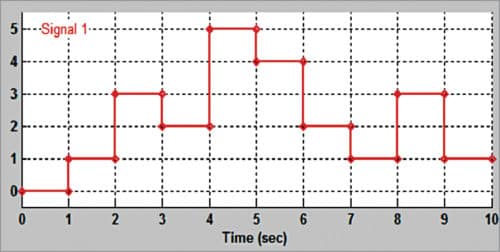
- To create a test stimulus in Signal Builder block for verifying the accuracy of the model, double-click on the block to open it. A new window will open, as shown in Fig. 2. Select Signal→Replace with→Custom… option, and enter y value as [0 0 1 1 3 3 2 2 5 5 4 4 2 2 1 1 3 3 1 and time value as [0 1 1 2 2 3 3 4 4 5 5 6 6 7 7 8 8 9 9].
- Connect the three blocks as shown in Fig. 1 and run the simulation to view the results.
Testing and simulation results
- Open MATLAB and go to Simulink Library Browser under FileOpen and locate the .slx file (MOBILELockUnlock.slx).
- After clicking on .slx file, a simulation window will open, which is the block diagram of the simulation(Fig. 1). It comprises three blocks, namely, input (Signal Builder), system (Chart) and output (Scope).
- Double-click on Signal Builder block to see input. A waveform will open (Fig. 2). This waveform indicates the stored password, of which one is correct (1 3 2 5) and the other is incorrect (4 2 1 3).
- Click on Chart block to open the internal structure/programming. Here, you will see shells S and E, and the stored password (that is, 1 3 2 5), as shown in Fig. 3.
After designing the simulation, testing is required to ensure the correctness of the design. For testing the simulation, compile the block diagram. When compiling is done, open the output or scope by double-clicking it. Input test stimulus and outputs (Pass and Fail) will be displayed in the waveform window, as shown in Fig. 4.
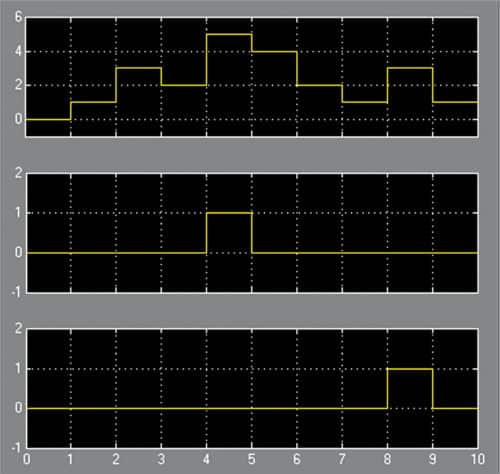
Top waveform is the input test stimulus containing a series of values (0 1 3 2 5 4 2 1 3 1) in the form of waveforms that are fed as inputs to the application.
Middle waveform shows the correct password (1 3 2 5), which produces output value 1 at the fourth clock input, indicating successful unlocking of the Android phone screen.
Bottom waveform shows the wrong password (4 2 1 3), which produces output value 1 at the eighth clock input, indicating an unsuccessful attempt.
Steps for changing the password
From Signal Builder block, select Signal→Replace with→Custom… and a Custom Waveform dialogue box will appear. Here, you can change time values and y values as per the new password. Time values (also known as t values) will be on x axis and y values on y axis.
1 3 2 5 is the default password and 4 2 1 3 is a random incorrect password. Values of x-y waveform for 1 3 2 5 numbers are as given below.
T- values = [0 1 1 2 2 3 3 4 4 5 5 6 6 7 7 8 8]
Y- values = [0 0 1 1 3 3 2 2 5 5 4 4 2 2 1 1 3]
Note that, t values may remain constant. You just have to change y values according to your new password.
After putting waveform values, go to the chart and update the same password in keypad input (Fig. 3). Then go back to the block diagram of the simulation. Run the simulation and check output on the scope. Make sure you have entered the correct new password, or else you will not be able to get the pass output graph.
Download source code: click here