
Earlier, we designed a smart energy meter that used a current sensor to measure current. In that version, we manually set the voltage range to calculate power usage and generate bills. However, manually entering the voltage led to inaccuracies, as voltage fluctuates over time, resulting in incorrect calculations.
This is an improved version of the device. We have added a voltage sensor along with a more reliable and accurate current sensor. By measuring both voltage and current directly, we can now calculate energy usage accurately in real time.
In addition, the system can monitor key parameters such as frequency, voltage, current, and power—all displayed on a single real-time dashboard. The device also securely stores billing and power usage data in a database, enabling better analytics and insights. Real-time graphs are generated for all parameters to enhance visualization.

We have further integrated IoT capabilities, along with smart analytics and data capture features. Using voltage and current data, the system calculates real-time energy consumption, total energy usage, and meter units. It can also generate billing in rupees or dollars, with a configurable price per unit defined in the code.
The database stores detailed records, including voltage, current, and energy consumption at intervals such as per second, minute, or year, allowing comprehensive analysis of power usage over time.
All this information can be monitored from any device, including smartphones, laptops, or smart TVs.
The best part is that the device is coin-sized, measuring just 3 cm in length. This makes the entire system compact, easy to set up, and highly portable.
Sensor Calibration
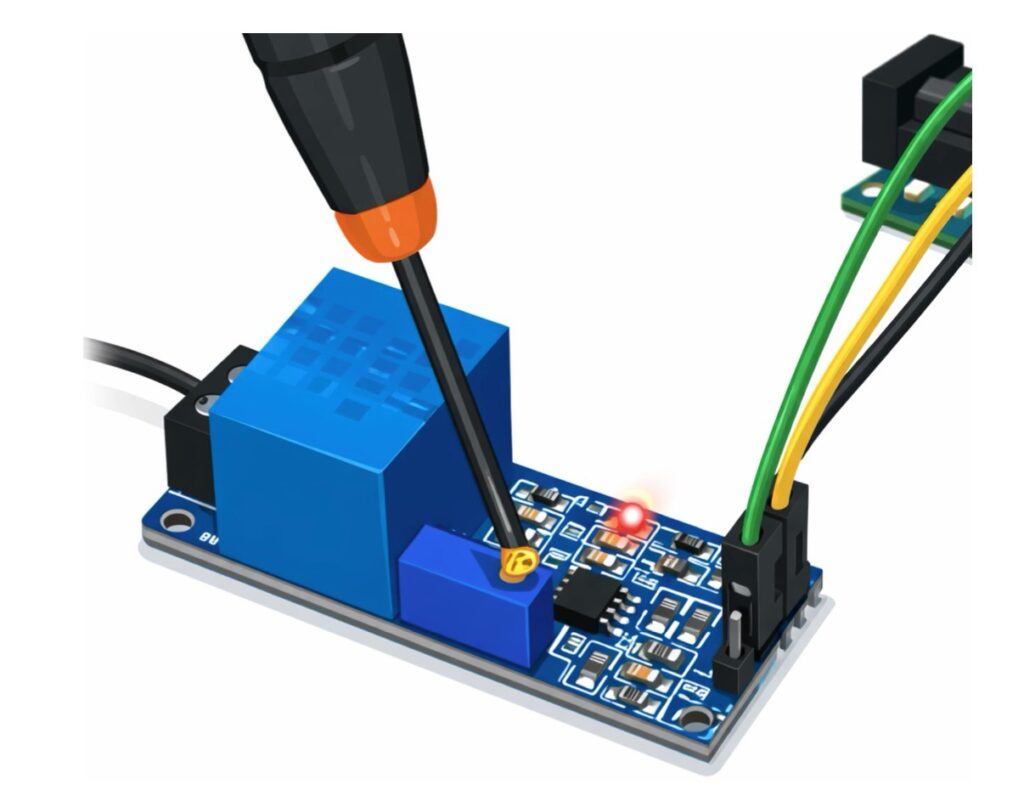
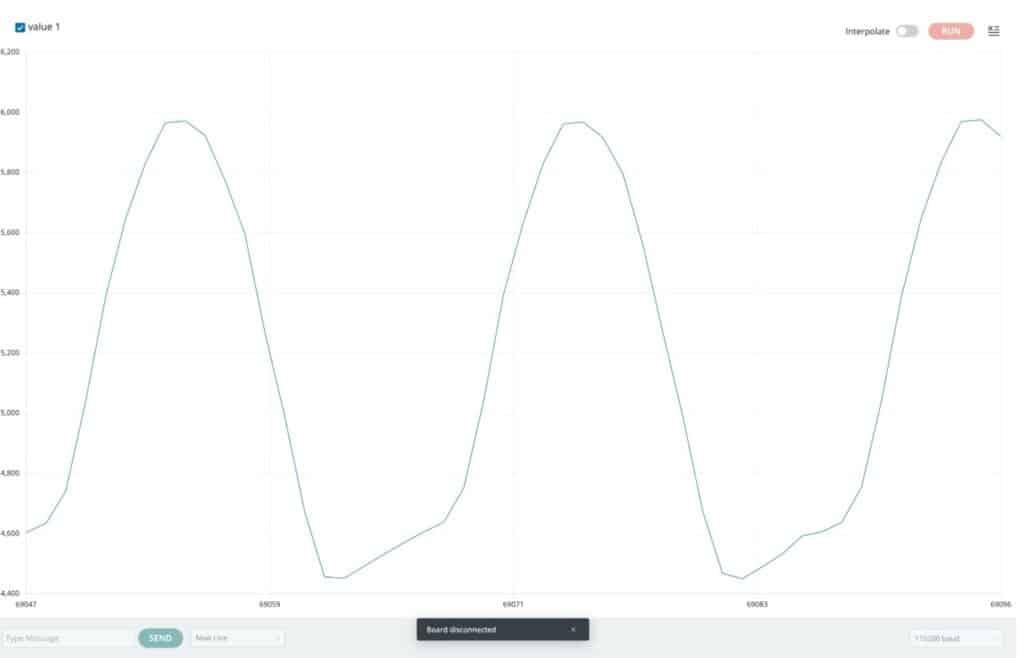
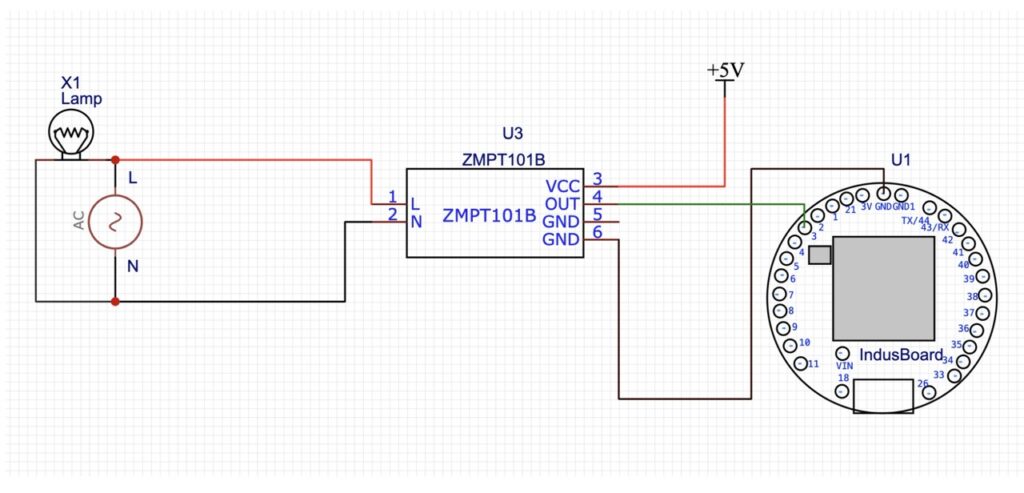
For AC voltage measurement, we use the ZMPT101B module, which is commonly used in most project designs and is suitable for this purpose. However, before using it, you need to calibrate it to obtain more accurate readings on two levels: one on the software level and the other on the hardware level. On the hardware level, the module provides a trim capacitor that you can use for calibration to obtain a full AC waveform for reading and plotting in the serial monitor. Therefore, first, calibrate the hardware.
Connect the sensor to the industrial board coin and then upload the calibration code. Next, open the serial plotter and rotate the potentiometer screw clockwise and counterclockwise to get a stable pure sine wave form in the serial plotter.
Calibration Code:
//---------------------------------------------------------------
void setup() {
Serial.begin(115200);
}
void loop() {
int raw = analogRead(3); // Your pinSerial.println(raw);
delay(1); // Fast for Serial Plotter
}
//------------------------------------------------------------------
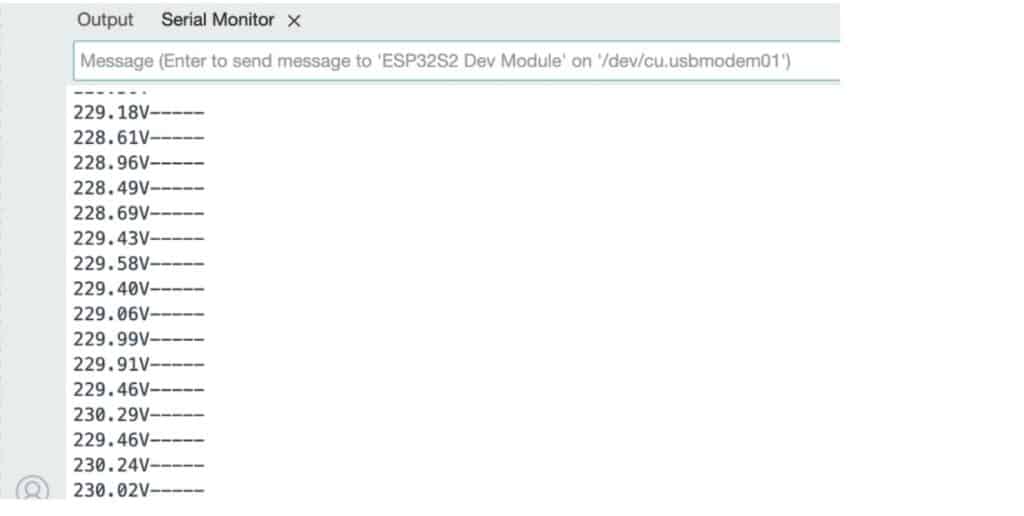
Voltmeter Measurement testing:
After obtaining the pure sine wave from the sensor, the full wave is visible on the plotter without any clipping. Now, you can read the voltage from the sensor using the ZMpt101b example code. If you have a multimeter, try to match the voltage reading from the sensor with the actual reading on the multimeter. However, if the reading is slightly higher or lower, you can perform further calibration by adjusting the sensitivity in the second line of the code.
#include <ZMPT101B.h>
#define SENSITIVITY 500.0f
// ZMPT101B sensor output connected to analog pin A0
// and the voltage source frequency is 50 Hz.
ZMPT101B voltageSensor(3, 50.0);
void setup() {
Serial.begin(115200);
// Change the sensitivity value based on value you got from the calibrate
// example.
voltageSensor.setSensitivity(SENSITIVITY);
}
void loop() {
// read the voltage and then print via Serial.
float voltage = voltageSensor.getRmsVoltage();
Serial.print(voltage);
Serial.print("V");
Serial.println("-----");
delay(1000);
}
Connection
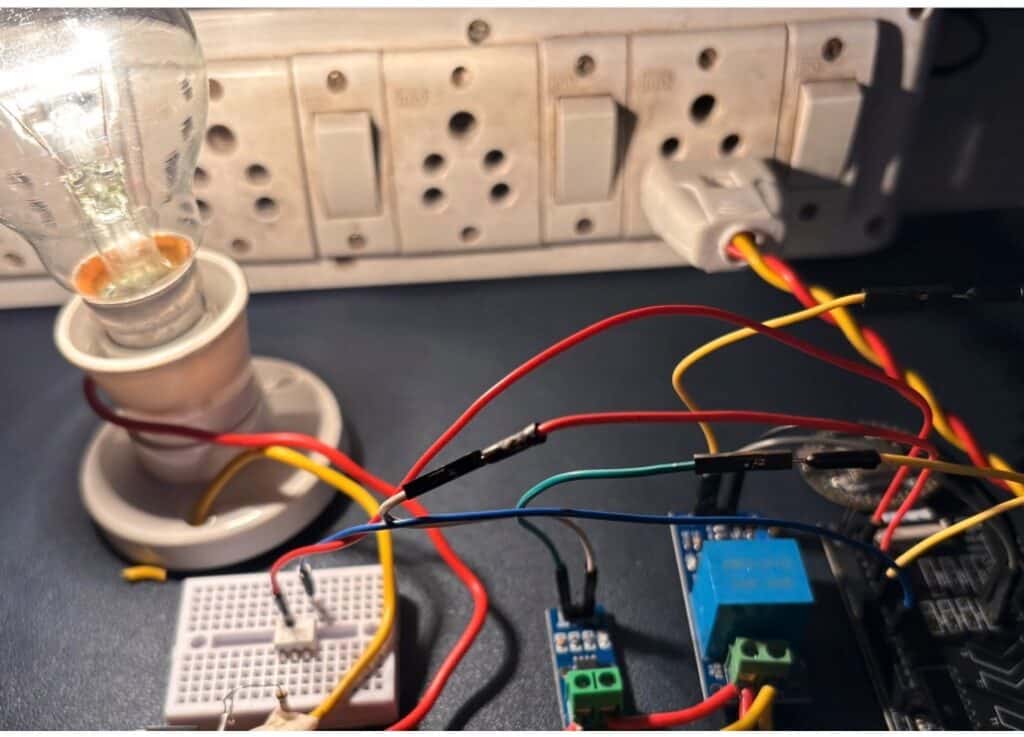
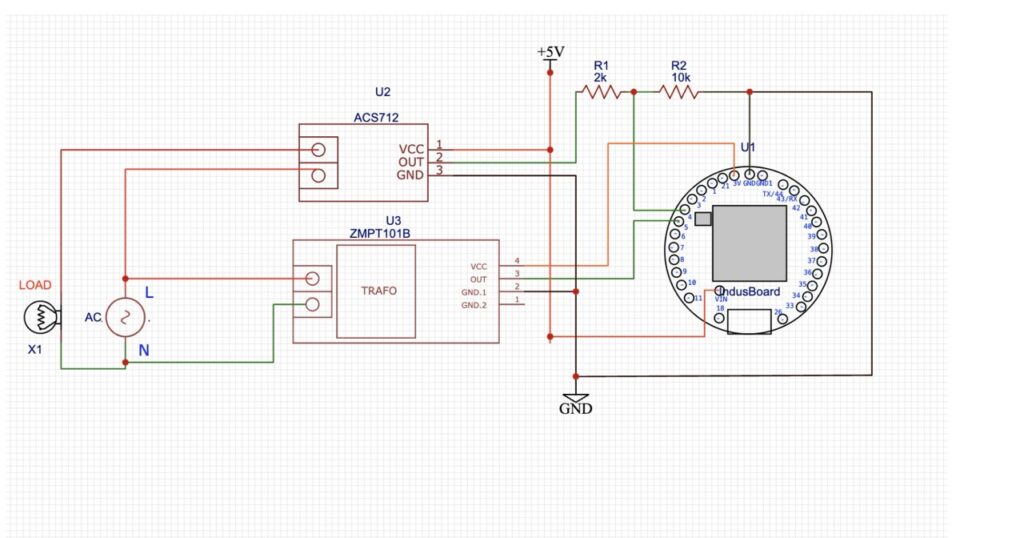
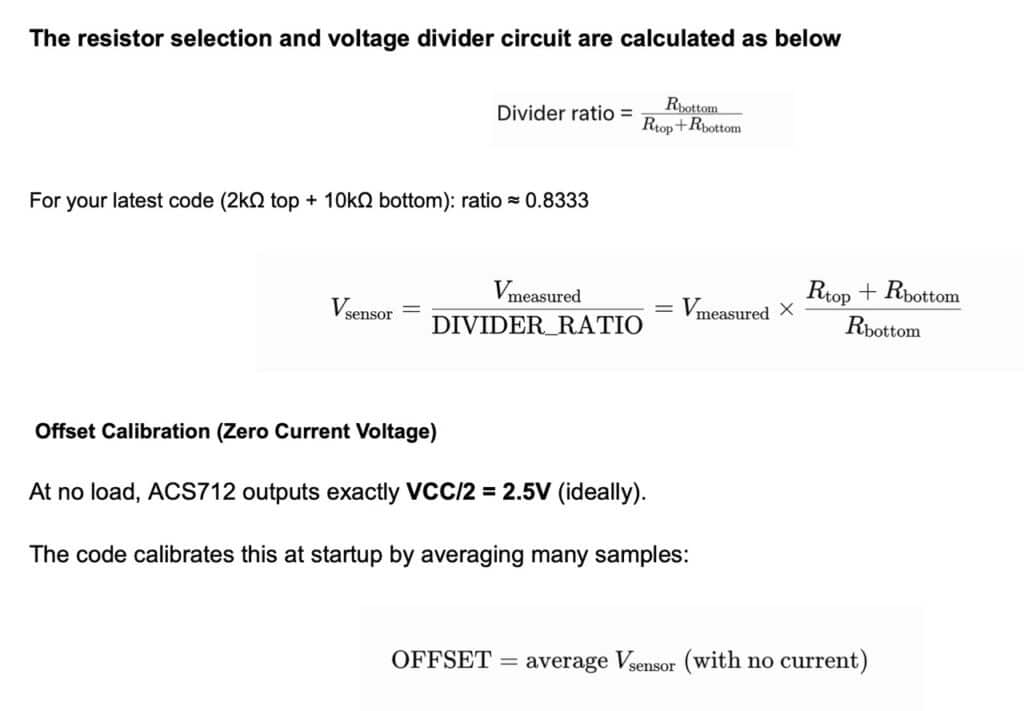
The current sensor output is connected to the industrial board coin through a voltage divider circuit, similar to the earlier design. The ZMPT gets powered from the industrial board coin, and the output pin connects to pin 5 or any other pin as configured in the code. The load connects to the live wire output from the current sensor and the neutral wire of the AC power line, as shown in the connection diagram.
Code for Energy Meter
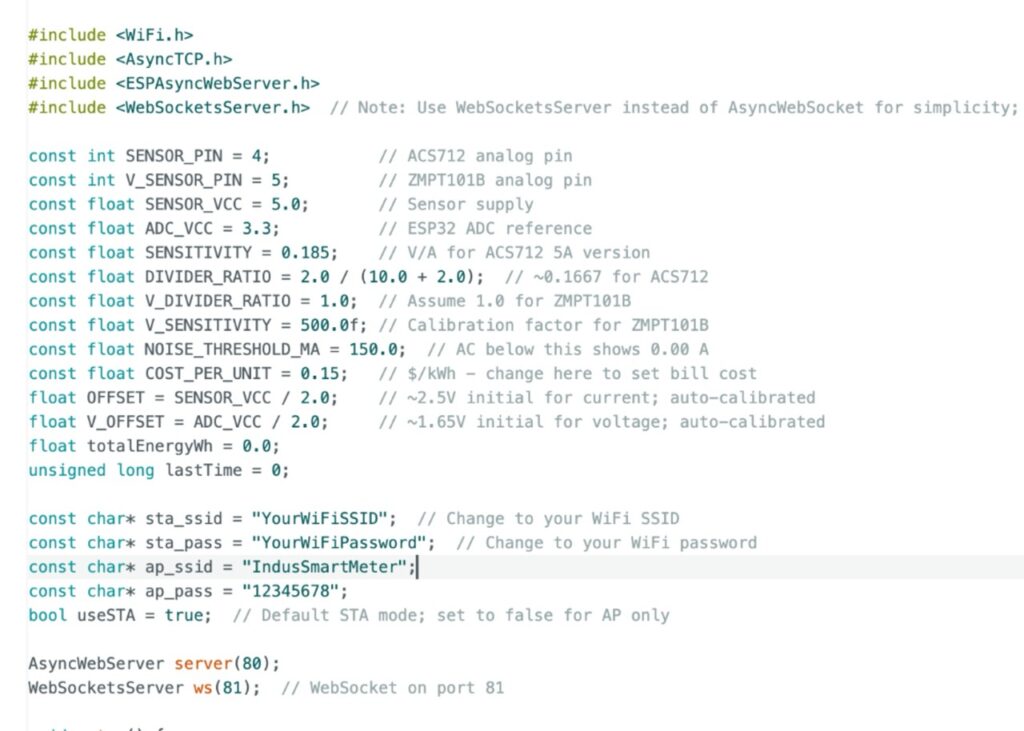
In code, you can configure the pins for the sensor and then the resistor ratio for the voltage divider circuit for the current sensor and the calibration factor. Similarly, configure the Wi-Fi mode (either AO mode or STA mode). In STA mode, it connects to your WiFi network as an access point, while in AP mode, it creates its own WiFi network. Next, configure the WiFi SSID and password according to your WiFi network, if using STA mode.
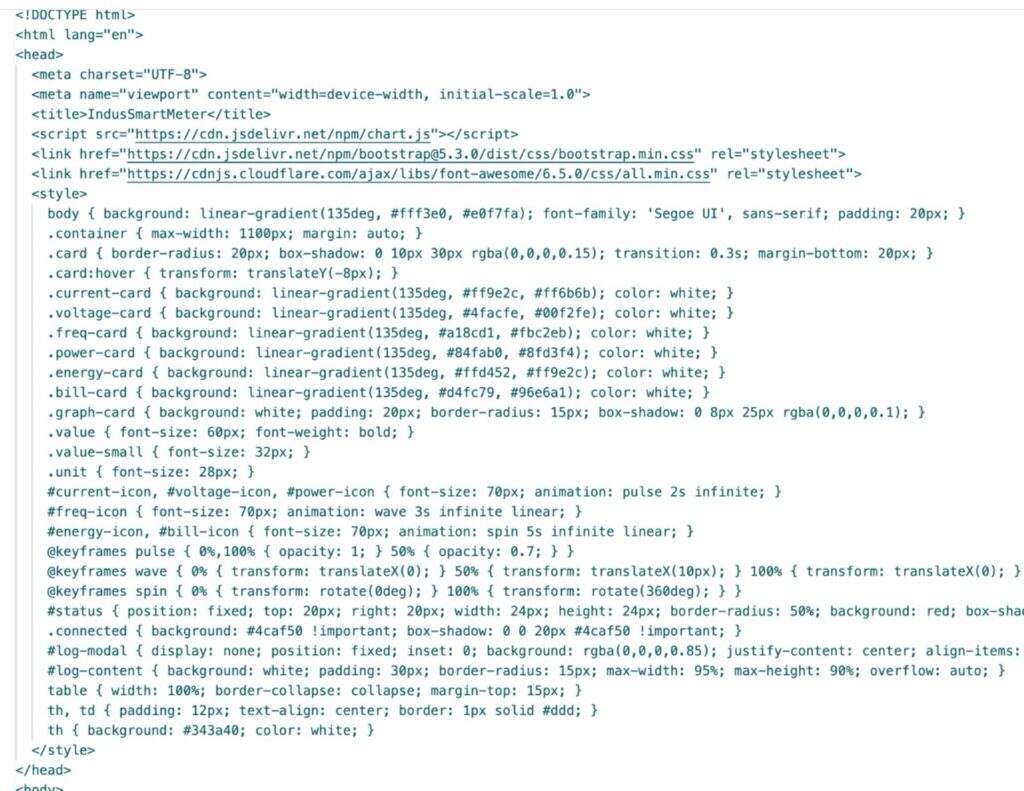
In the next part of the code, the sensor data is retrieved, updated, and sent to the web server. Afterwards, the HTML code is used to create the UI, where different cards with a photo display particular sensor values, energy consumption, and bills. All these elements are added, and the graph part is added to plot in real-time. Finally, we will include a button named “Show DB” in the UI. When this button is pressed, it displays the entire database of energy usage, voltage, and current data, along with the bill, in a table for each second.
Testing Energy Meter
Now, after uploading power to the device either using a USB cable or a power adapter with a 5V/Vin pin, wait for a few seconds. It will then connect to Wi-Fi and automatically calibrate the sensors.
After waiting a few seconds, the device will power the AC line and load. Now, open the Wi-Fi scanner app or serial monitor to check the IP address.
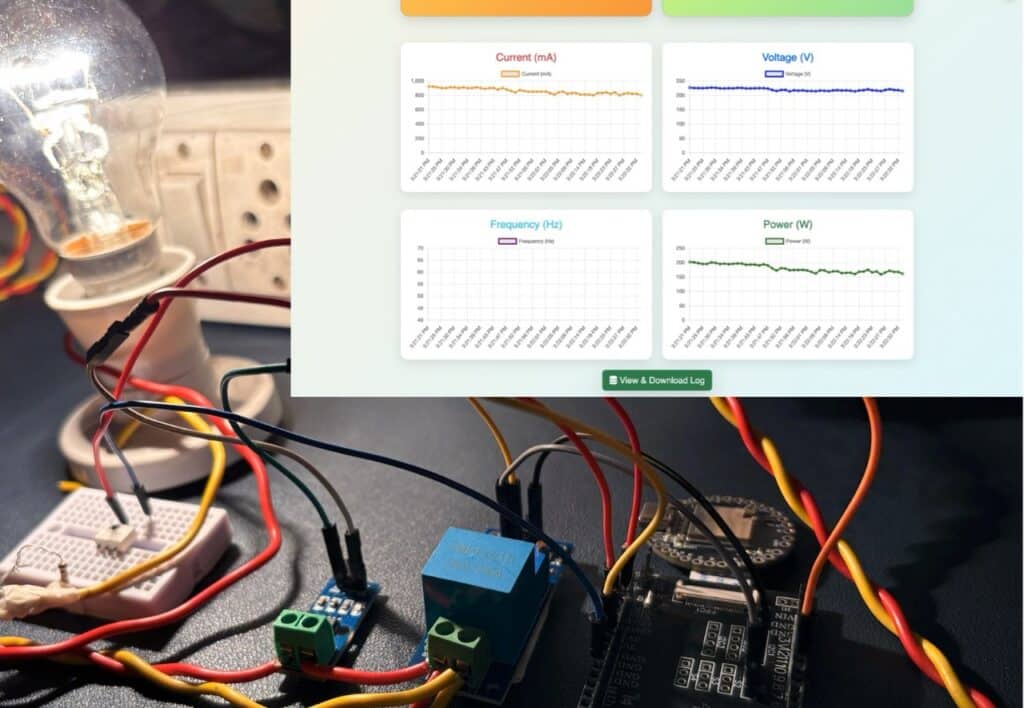
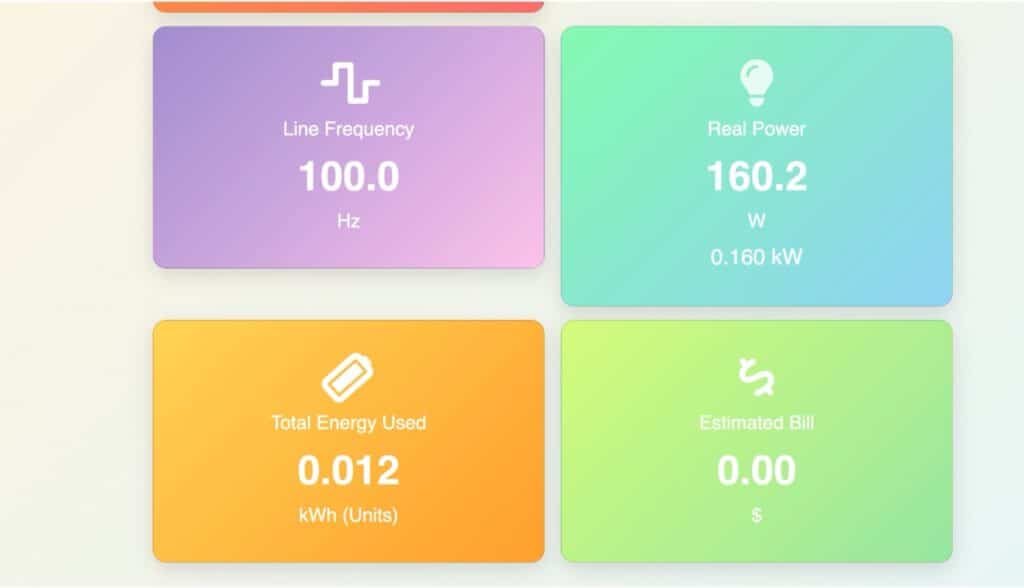
Then, open the web browser and search for the IP address. You will see the WebApp UI displaying real-time voltage, current, energy usage, total units, energy used, and electricity bill, along with a real-time graph.
At the bottom, you will get a “Show DB” option. Clicking on it will display the database of every second and every detail value.