


In logistics, keeping tabs on deliveries and large shipments is essential. Tracking them individually on Google Maps and making route adjustments when there are obstacles can be quite cumbersome.
In this article, we’ll create a user-friendly logistics tracking system that integrates with Google Sheets. This system displays real-time information about each parcel, its logistics route, and its current location, updating every second. You can also view maps of all these logistics in real-time and easily share the tracking URL.
Bill of Materials
| Components | Quantity | Description | Price Approx |
| AIR 530 GPS | 1 | Serial GPS Module | 500 |
| ESP CHIP /Butonboard | 1 | Microcontroller | 900 |
| Battery | 1 | 3.3V Micro | 300 |
| Total | 1800 |
Using Google Sheets for Real-Time Tracking
To start, we’ll create a Google Sheet to list and track shipments and cargo. Then, we’ll follow the instructions for setting up the Google Sheet app and deployment as outlined in my previous article, IoT Data Logging Using Google Sheets.
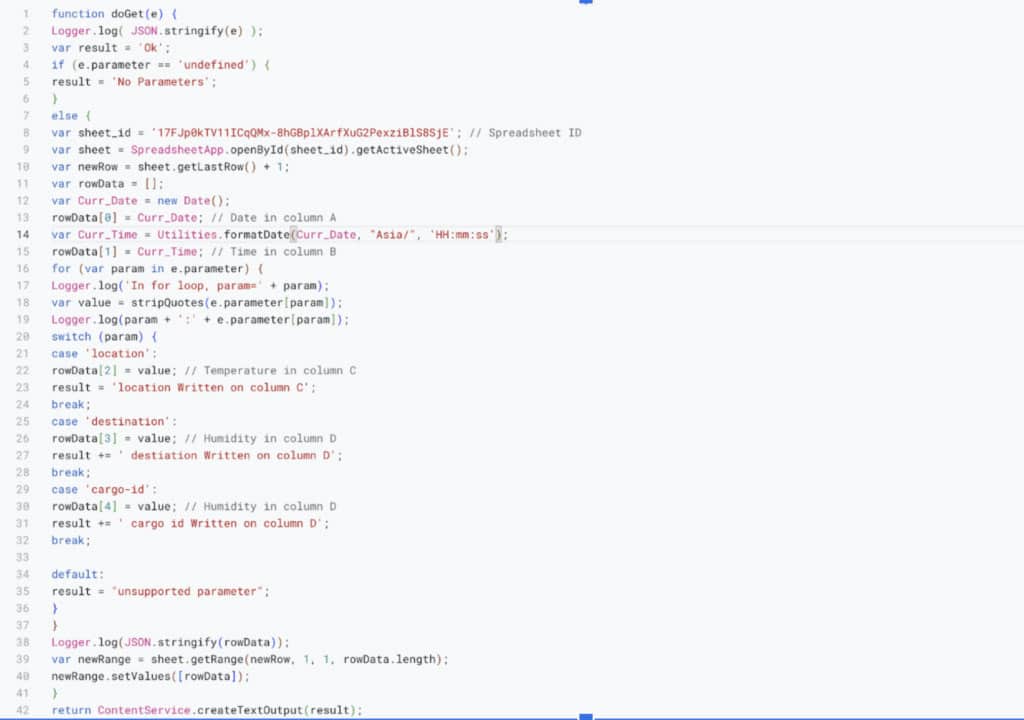
Then use the following script for automatic update and management of the sheet using the API key. And then follow the instructions from the previous article for the deployment of the script as an app.
Real-Time Logistics Tracking – Code
Begin by opening Arduino and installing the “TINY GPS” library and the “SoftwareSerial” library for ESP8266. Then, in your code, import these libraries and set up the necessary configurations, such as Wi-Fi and the Google Sheets API key.
For configuring the Wi-Fi, ensure that you specify your Wi-Fi credentials (SSID and password) within the code.
Insert your Google Sheets API key in the appropriate section of your code for authentication.
Next, configure the Software Serial pin. You can choose any available pin on your board for this purpose.
In this example, we’ve used pin 10 (RX) and pin 11 (TX) for Software Serial communication with the GPS module. Adjust this configuration as needed for your specific hardware setup.
Now create the setup function and start the serial and software serial with the baud rate that your GPS support here we are using AIR530 GPS and its default baud rate is 9600 so we use the same baud rate in the setup function.
Next, we create the loop to check the GPS data and upload it to Google Sheets. Here in my prototype design, I used the Wi-Fi to connect with the internet and data uploading.
- Setup Function: In this function, initialize the serial communication for debugging (Serial.begin) and the Software Serial communication for the GPS module (ss.begin). Connect to your Wi-Fi network using the provided credentials and print status messages until the connection is established.
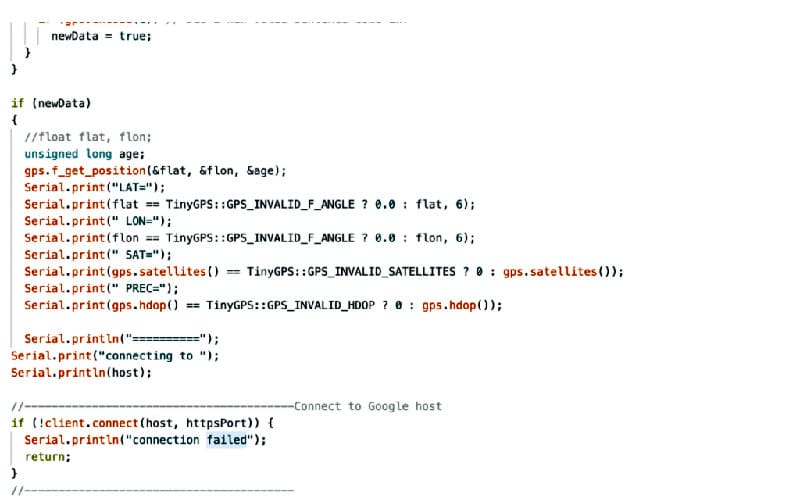
- Loop Function: This function continuously reads GPS data, parses it using the TinyGPS++ library, and uploads it to Google Sheets using your API key. Adjust the delay as needed for your application’s requirements.
But In real-world IoT logistic tracking, different approaches are employed depending on the situation. For sea-based cargo, satellite-based IoT chips are often utilized. Meanwhile, for other scenarios, such as land-based logistics, GSM or scan-based tracking systems may be preferred.
Regardless of the chosen system, the fundamental process remains consistent: connecting the device to the internet and transmitting real-time data to the Google Sheets or other data storage platform. This standardized approach ensures effective tracking and monitoring across various logistics scenarios.
You can download the complete code, available at the end of the article.
Connection
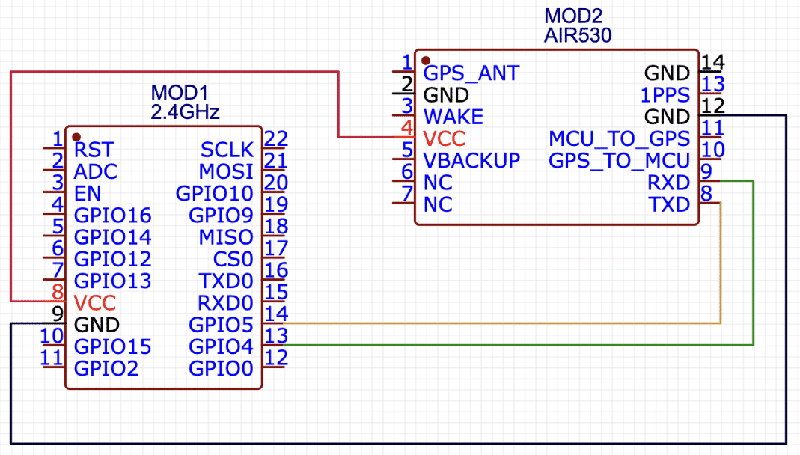
Now connect the components according to the circuit diagram.
Testing
Once you’ve powered up the device and given it a few moments, it will start uploading location data to Google Sheets. Each entry will include the cargo or shipment ID number, which is visible in your Google Sheets document.
In Google Sheets, you have the flexibility to customize and enhance your data as needed. You can add functions to calculate various aspects, such as the remaining distance to cover, identify parcels that have been stationary for an extended period (indicating potential issues), or even adjust the routing of shipments.
You have the freedom to structure your data, view maps, and locations according to your preferences.
By maintaining all your shipments and logistics data in a central Google Sheet, you can easily generate graphs and analytics to gain insights into your operations.
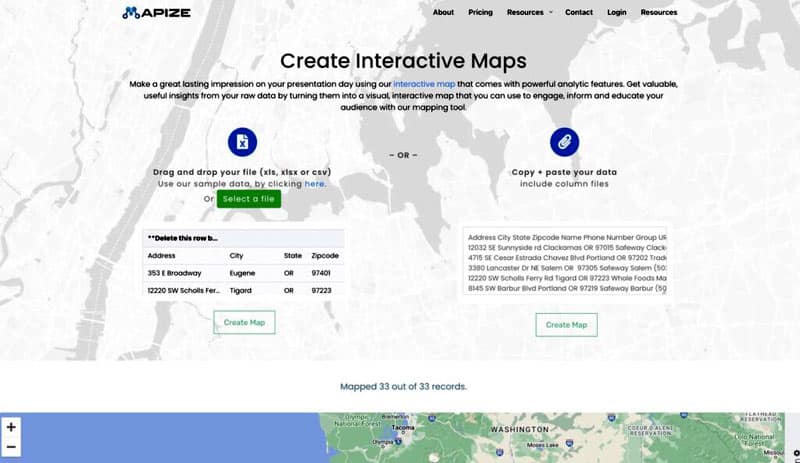
If you need to visualize the paths, routes, and location points, you can utilize free websites like https://www.mapize.com/ or similar services. Simply copy the location data and paste it into these platforms, and they will create route maps with all the location points plotted for your convenience.
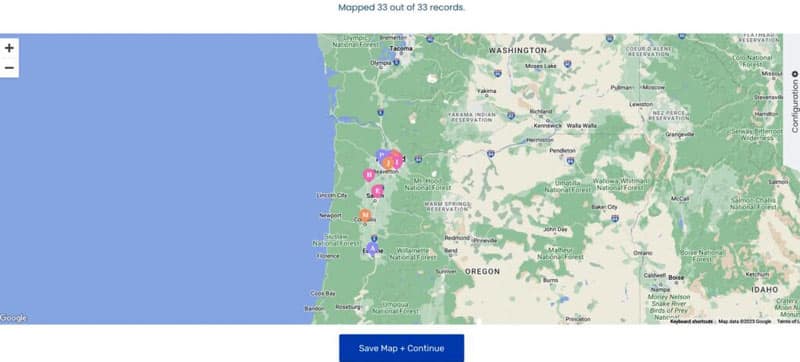
This allows you to further analyze and optimize your logistics and cargo tracking efforts.
For more such interesting projects, check DIY Projects, guides, and tutorials