





Two beams, one pour day, very different strengths? Calendar age hides the real story. Build it under ₹2500: an ESP32 and three embedded sensors that log concrete’s temperature history and calculate its maturity—wirelessly!
Time: 4-5 hours
Complexity: Medium

Two beams poured on the same day can end up with very different strengths. Calendar age hides what matters: temperature history. Concrete does not gain strength at a constant rate because hydration is strongly driven by temperature, so two elements of the same chronological age can be at very different stages of development.
This ESP32-based system embeds three DS18B20 sensors within a concrete pour and records that history. It continuously calculates the average temperature, the temperature difference between locations, Nurse–Saul maturity, and Arrhenius equivalent age, all without an internet connection.
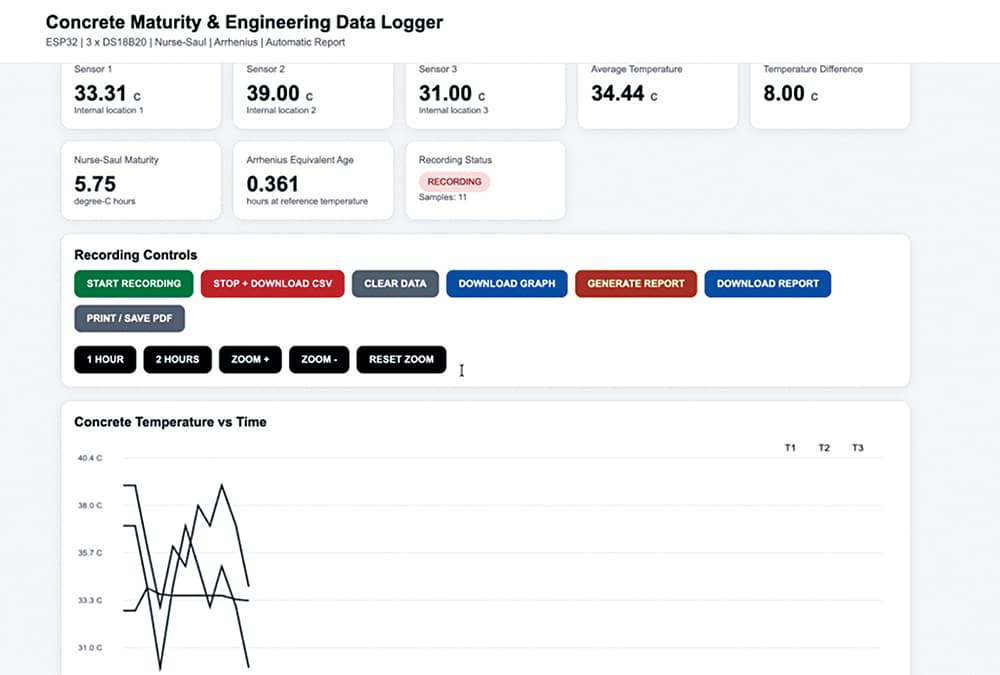
The ESP32 creates its own Wi-Fi access point, named ‘Concrete-Maturity’. A phone, tablet, or laptop connects directly to it, and opening 192.168.4.1 in a browser shows a live dashboard of temperatures and maturity values. The dashboard doubles as a data logger: readings are timestamped and stored in the browser while recording, and you can export a comma-separated values (CSV) file, save the temperature graph as an image, or generate a self-contained hypertext markup language (HTML) engineering report with measured ranges, maturity values, equivalent age, the graph, and a plain-language interpretation.
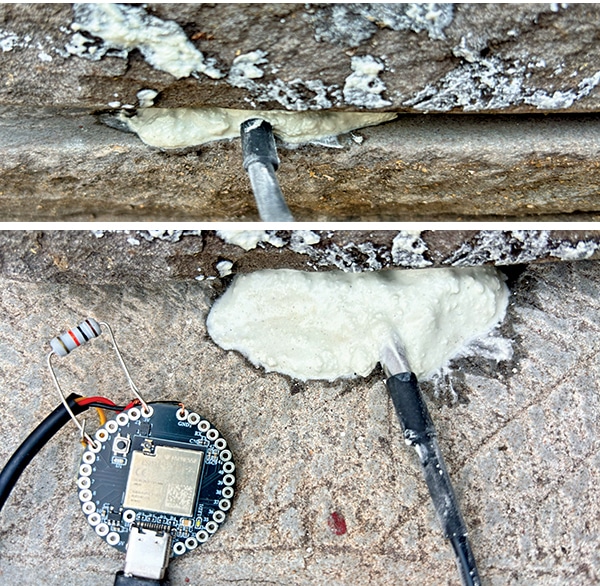
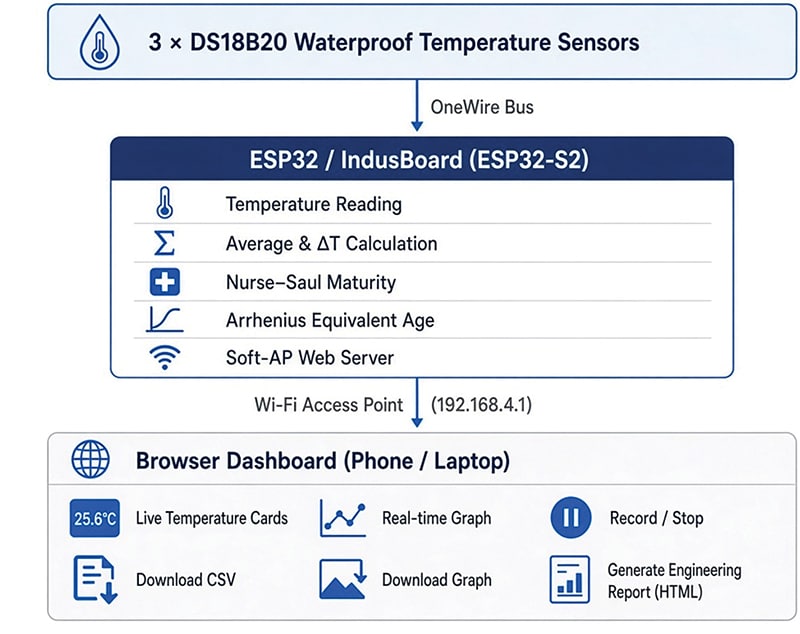
Why does this matter? A simple thermometer shows only the present temperature. This device keeps a verifiable record of the whole curing period, helping check casting and curing practices on poorly supervised sites, where inadequate placement and curing have contributed to beam and bridge failures. Fig. 1 shows the author’s prototype, while Fig. 2 presents the block diagram of the project.
| Bill of Materials | ||||
| Reference | Component | Value/Type | Quantity | Price (₹) |
| MCU1 | ESP32 board | IndusBoard (ESP32-S2) or any ESP32 board | 1 | 1800 |
| S1-S3 | Temperature sensor | DS18B20, waterproof probe | 3 | 180 (60 each) |
| R1 | Resistor | 4.7kΩ, ¼ W, 5% carbon film | 3 | Miscellaneous 520 |
| C1 | Ceramic disc capacitor | 0.1µF | 1 | |
| – | USB cable | For programming and power | 1 | |
| – | Protective enclosure | For field use (optional) | 1 | |
| Total | 2500 | |||
What will you learn?
- How an ESP32 reads multiple DS18B20 sensors over a OneWire bus.
- How to compute temperature statistics and integrate temperature over time.
- Why concrete age and concrete maturity are not the same thing.
- How to serve a live dashboard from the ESP32 in access-point mode.
- How to export data as CSV, a graph, and an automatically generated report.
How it works
The three DS18B20 sensors measure temperature at different locations and talk to the ESP32 digitally over the OneWire protocol. The ESP32 requests a conversion, stores the readings as T1, T2, and T3, then computes the average and the difference between the highest and lowest values.
The average temperature is integrated over elapsed time to give the Nurse-Saul maturity:
Maturity=Σ[(T−T0)×∆t]
where T is the measured temperature, T0 is the datum temperature, and t is the time interval. The result is in °C·h. For example, concrete held at 30°C with T0=0°C adds about 30°C·h in one hour and 300°C·h in ten hours.
In parallel, each reading is converted into an Arrhenius rate factor:
exp[−(Ea/R)(1/T−1/Tr)]
where Ea is the apparent activation energy, R the gas constant, T the absolute concrete temperature, and Tr the absolute reference temperature (commonly 20°C). Accumulating this factor over time gives the equivalent age at the reference temperature, so pours with different temperature histories can be compared on a common scale.
Nurse-Saul is a straightforward temperature-time index, while Arrhenius models the non-linear reaction rate more explicitly. Both describe the same temperature history, so the report shows them together with the measured temperature range.
The ESP32 serves the results on a local web page. The browser fetches the latest values from the data endpoint, updates the display and, when recording is active, stores each point with a timestamp.
The overall flow is: Temperature sensorsESP32Temperature processingMaturity calculation Wi-Fi dashboardData logger GraphEngineering report.
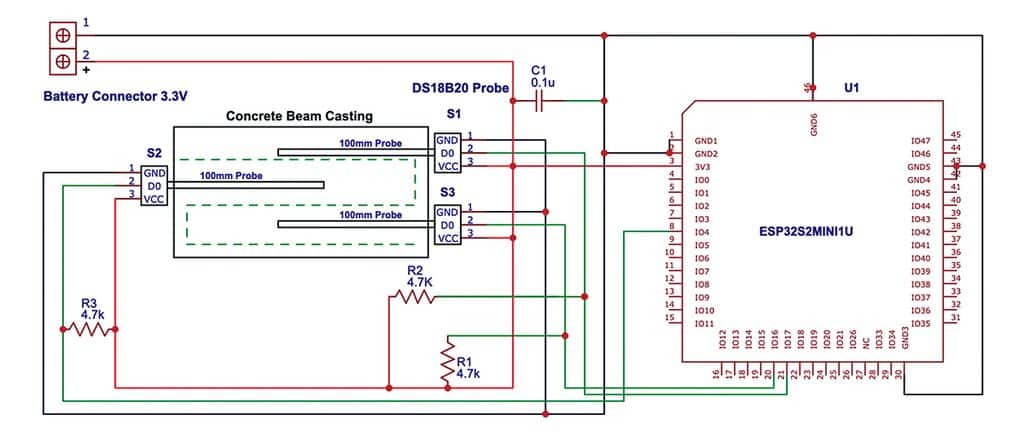
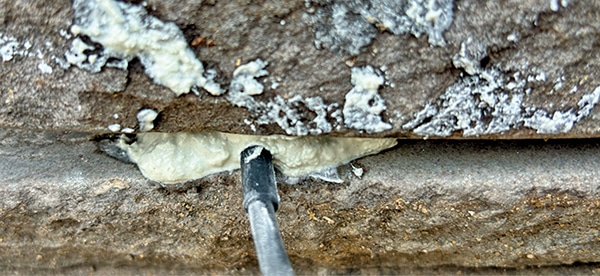
All three DS18B20 sensors share the 3.3V and GND supply and a single OneWire data line, with one 4.7kΩ pull-up resistor (R1) from the data line of each to 3.3V. A 0.1µF capacitor (C1) across the supply, close to the sensors, suppresses noise. Connect the components as in Fig. 3, then place the sensors in the middle and bottom layers of the pour as shown in Fig. 4.
The software/code
ESP32 firmware
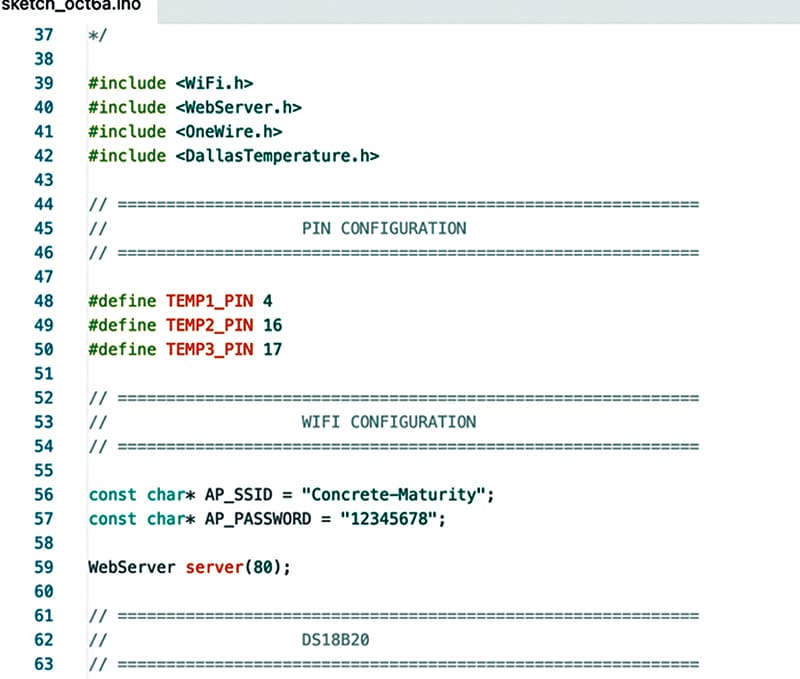
It handles temperature acquisition, the maturity calculations, and the web server, using the OneWire, DallasTemperature, and WebServer libraries. Install OneWire and DallasTemperature from the Arduino IDE Library Manager, then set the access-point name and password (Fig. 5).
Browser dashboard
It requests data from the data endpoint, updates the live display and graph, stores recorded points, and generates the CSV file, the graph image, and the HTML report. Since everything runs on the ESP32 and the browser, no cloud server is needed.
The report contains sensor statistics, the temperature range, the maximum inter-sensor difference, both maturity values with their parameters, an embedded graph, and a plain-language interpretation.
EFY note. Set the datum temperature, reference temperature, and activation energy to suit your mix before trusting the maturity values.
Construction
Assemble the circuit on the PCB as per Fig. 1, with the 4.7kΩ pull-up resistors between the data line of each sensor and 3.3V, and the 0.1µF capacitor across the 3.3V and GND lines where the sensor cables connect to the board. Check that all three sensors are detected before going to site. The waterproof probes can be embedded directly in the concrete. Tie the probes at the chosen depths, in the middle and bottom layers, before casting, so they do not shift during placement, and route the cables to the ESP32, which stays outside the concrete, ideally in a protective enclosure.
Testing
- Connect the three sensors and open the Serial Monitor at 115200 baud. Confirm that all three are detected.
- At room temperature, the three readings should be reasonably close to each other.
- Connect a phone or laptop to the ‘Concrete-Maturity’ Wi-Fi network and open 192.168.4.1 in a browser.
- Check that the live temperatures and graph appear.
- Click ‘Record’ to start sampling during the pour. After the desired period, click ‘Stop’.
- Click ‘Download CSV’ to save the temperature history, and ‘Download graph’ to save the curve as an image.
- Click ‘Generate report’. The system calculates Nurse–Saul maturity and Arrhenius equivalent age and builds the report. Download it as an HTML file that opens in any browser (Fig. 6).
Reading the report
Start by checking the overall temperature range and the maximum difference between sensors. A small difference, ideally below 5-8°C, suggests fairly uniform curing.
Nurse–Saul maturity (°C·h) generally rises as hydration progresses, but the value that indicates adequate early strength depends on the mix. Establish it by correlating maturity with laboratory cube-strength tests.
Arrhenius equivalent age converts the recorded history into an equivalent curing time at the reference temperature, making different pours easier to compare. Keep the CSV files and reports from multiple pours to build a site-specific database. Over time, this can help determine suitable maturity levels for decisions such as formwork removal or loading for specific concrete mixes.
Troubleshooting
Invalid readings usually point to a missing pull-up, a poor power or ground connection, or a faulty data line. If the web page does not open, make sure your device is connected to the ESP32’s access point and not another network. A ‘too few points’ message simply means the recording was too short. If maturity values look wrong, recheck the datum temperature, reference temperature, activation energy, and sampling interval.
Applications
Future enhancements
With proper calibration, it can become a practical field instrument, with multiple units covering different locations on a site. Future versions may add SD-card storage, a real-time clock, battery operation, long-range radio, or cloud sync. The most valuable next step is correlating maturity with laboratory compressive-strength results so that the device can estimate in-place strength rather than only report temperature history.
By: Ashwini Kumar Sinha, an IoT and AI enthusiast, is Tech Journalist at EFY