


 An electrocardiogram (ECG) acts as the health indicator of our heart and with the help of electrodes, placed either on the chest or at the arms, we can sense the beating of the heart. The same signals can be visualized as waveforms on the computer screen or on the printer. It is a graphical representation of the difference in the electric potential of the heart during one cardiac cycle. A low-cost real-time ECG machine is proposed here using Arduino and a single lead. It also puts up an alarm when the signal exceeds a pre-decided threshold value.
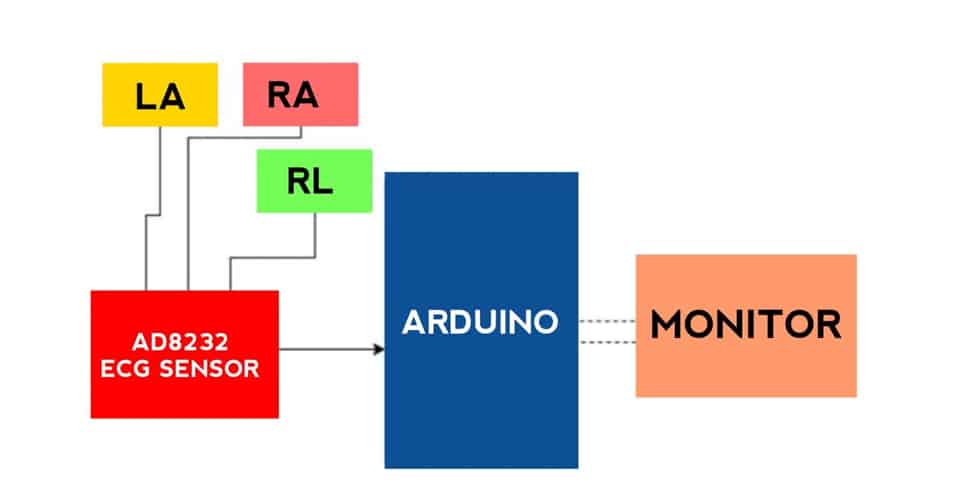
The present setup consists of three body electrodes (LA goes to the left arm, RA goes to the right arm and RL is the right leg)
| Components | Description | Quantity |
| AD8232 Sensor ( MOD 1) | ECG Sensor module | 1 |
| Electrodes | 3M ECG Adhesive type electrode | 3 |
| Arduino Uno (MOD 2) | Microcontroller | 1 |
| Buzzer (B 1) | 3-5V Buzzer | 1 |

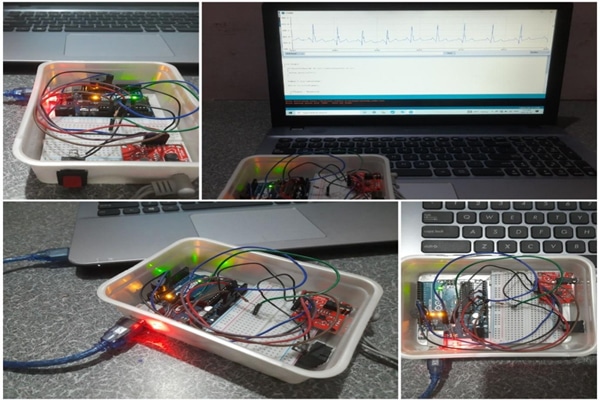
Connected via sensor AD8232 through an Arduino with the display as seen on the monitor. Figure 1 displays all the mentioned components a table 1 has the list of components needed in this project.
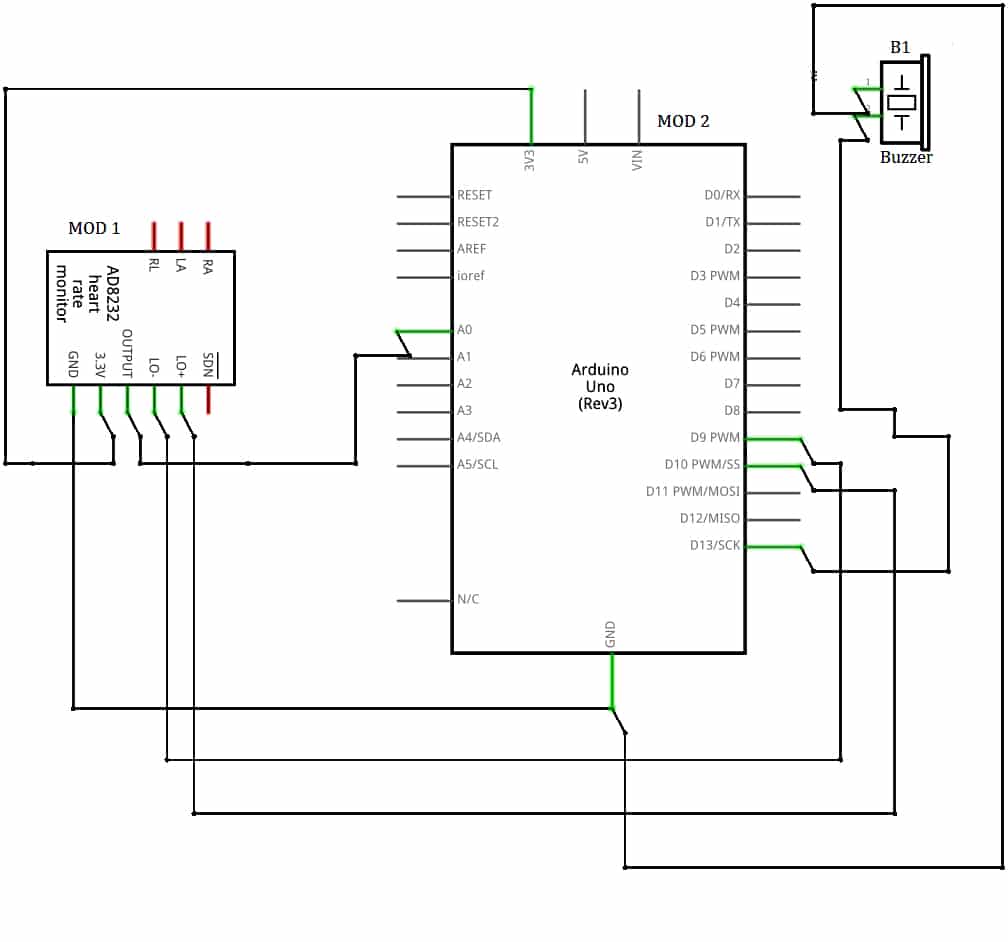
An Arduino code is created and uploaded to Arduino by selecting the right port and board type in Arduino IDE. After that, the AD8232 is connected according to the circuit diagram in Fig 3.
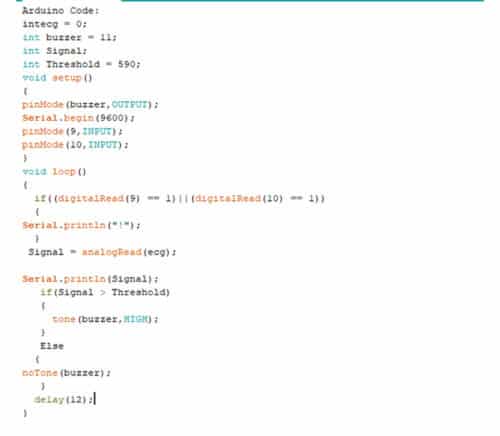
Download Source Code
Circuit and working
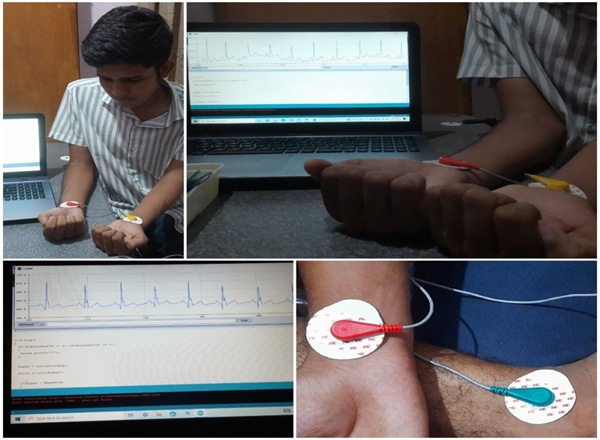
To obtain a standard ECG, electrodes are attached to the three vital points; the most common configuration (called the single lead) being – one wrist each on both the hands and the right leg through three electrical leads for monitoring the functioning of the heart. Refer fig. 4 to understand the preferred locations and the color code of the electrodes and connectors with respect to a human body.
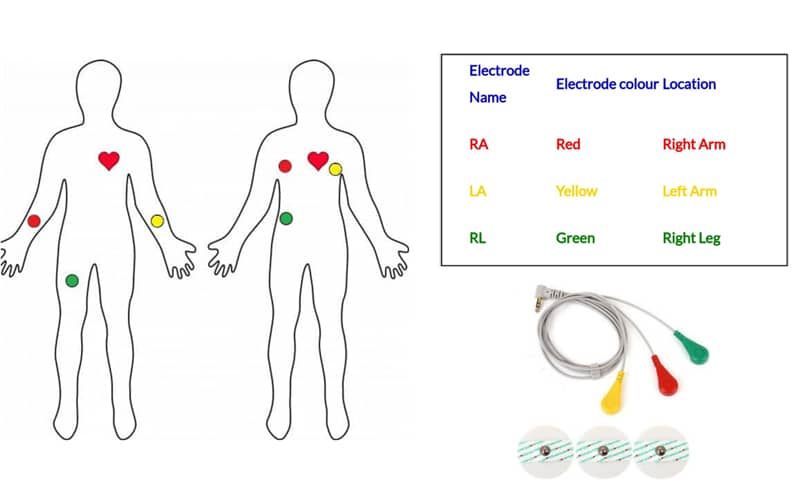
Biopotential electrodes are crucial in monitoring ECG & EMG signals. Applying the right type of electrode that last for a longer time and assist in recording high-quality signal is desirable in the medical devices industry. These electrodes, which are cheap and easily available on the market, are composed of Ag/AgCl electrodes surrounded by a conductive gel, whose resistivity is about 100 Ω.m. The gel is surrounded by an adhesive material that is used to fix the electrodes.
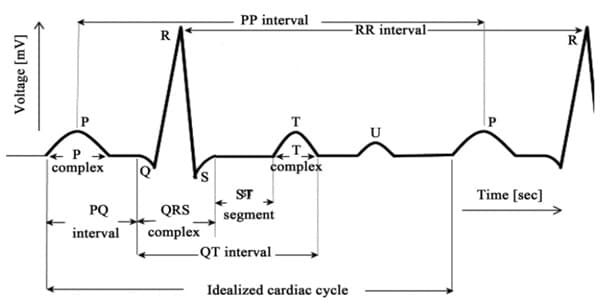
The ECG graph contains repetitive cycles, and each cycle contains P, Q, R, S, T and U intervals. Ref fig 5 for a complete representation in terms of a waveform. The sinoatrial node (SA) is the pacemaker of the heart and produces the P wave. The QRS wave is produced by the AtrioVentricular (AV) node. The P wave in an ECG complex indicates Atrial depolarization. The QRS is responsible for ventricular depolarization, and the T wave is ventricular repolarization. QRS wave comprises a small Q wave, a high R wave, and a small S wave. The QRS segment offers information about the ventricular systole concerning the impulse propagation of the ventricles (Q wave). The R and S waves cause transmission to the whole tissue.
Testing
Results
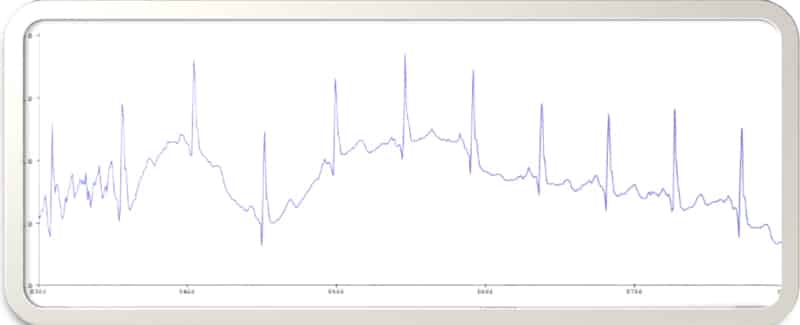
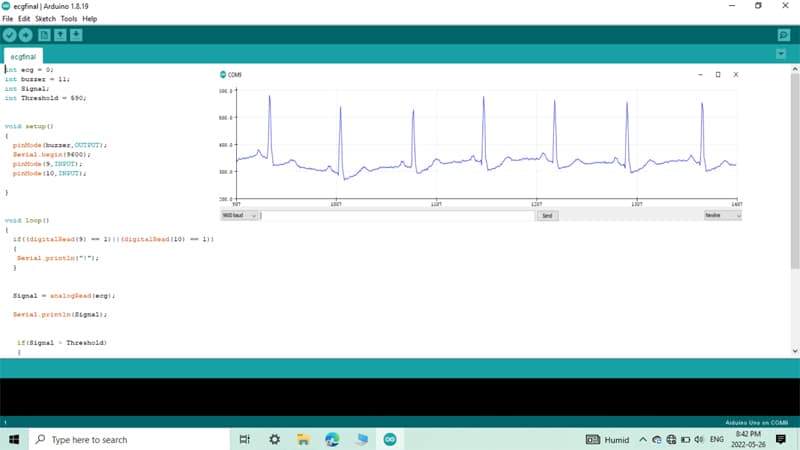
As per the instructions shared, the electrodes are attached at the mentioned positions. The Arduino is powered and a serial connection with the Arduino allows receiving the data at the baud rate of 9600 – the rate of data transfer from Arduino to the laptop/workstation. Pin 9 and 10 of the Arduino is used to receive the ECG sensor output and the same is printed on the serial plotter. Pin 11 is used for the buzzer operation. Whenever signal amplitude goes above the threshold of 590 microvolts, the buzzer is set on indicating hyperactivity.
Dr. Geetali Saha, Faculty, Dept of Electronics & Communication, G H Patel College of Engineering & Technology (GCET) Anand, Gujarat-388120.
This project is implemented by Kushal Gadhavi, EC, GCET He is a Bio-med Electronics enthusiast.