IEEE 802.15.4-based wireless sensor networks (WSNs) have witnessed explosive growth in the recent past because of their position-independent sensing capabilities even in toxic and inaccessible regions to humans, the low cost of sensors, and a very long field lifetime given by their low power consumption. WSNs are formed by a large number of networked sensing nodes and it is sometimes complex to analytically model it. There are many simulation software for WSN, including NS 2, SENSE, NetSim, OPNET and OMNeT++.
This article is based on NetSim simulation. This simulator can be used to analyse data packet delivery, probability of packet being discarded and other parameters in wireless networks. It can also give you the simulated output in the form of graphs for analytical purposes. IEEE 802.15.4-based wireless sensor networks can support a maximum of 250 kbps for 2.4GHz bandwidth. Therefore WSNs are employed in those areas where a phenomenon (like intrusion detection or fire alarm) has to be sensed and the packets are generated at a very low data rate. However, the standard has limitations on network throughput as the load increases.
Here, we will talk about the measures that can improve the performance of 802.15.4, thereby enabling support for high-bandwidth applications, such as video, and providing reliable quality of service (QoS) guarantees. Transporting such applications over a WSN will provide substantial benefits to diverse areas ranging from internal security to surgical medicine. As the load increases, the sensors’ attempt rate remain constant, resulting in more collisions leading to a decrease in performance. Attempt rate mainly depends on the backoff time that the sensor takes. Clearly, by increasing the backoff time, we can decrease the attempt rate, thereby improving the performance at higher loads. This can be done either by increasing the backoff multiplier or the backoff exponent limits (macMinBe and maxBE). Based on the above logic, we have modified these parameters in NetSim and ran simulations.

WSN simulation program
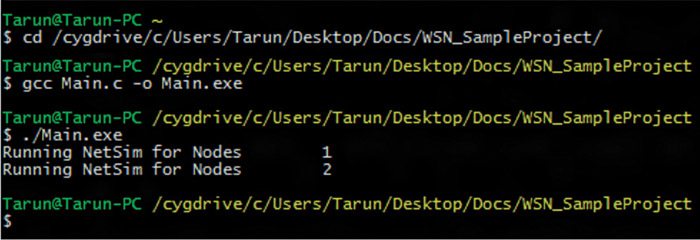
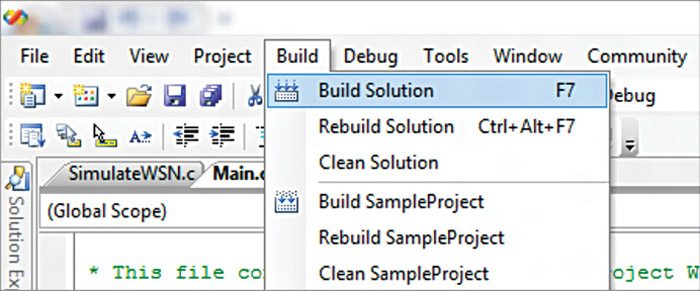
This program has been developed using NetSim’s development kit. It allows users to develop custom codes, simulate their models and statistically analyse performance metrics. WSN library contains ‘C’ source code for the primitives, and the configuration files are available as ‘xml’ files.
Relationships
Throughput. Average rate of successful packet delivery. In terms of NetSim’s metrics, it is given by:

Throughput = (Frames Transmitted-Frames errored)/Simulation Time
Attempt rate. Number of backoffs over the time spent in backoffs (per node basis) is given by:
β=Number of backoffs or attempts/(Time spent in backoff + CCA)
Where CCA is clear channel assessment.
Attempt rate gives the number of attempts made by the sensor in a backoff slot, i.e., the probability that a sensor attempts in a backoff slot given that it has a packet. A backoff is followed by CCA and an attempt can be a success or failure. A successful attempt involves a frame transmission and a failed attempt involves CCA failure. Therefore the number of backoffs/attempts is the sum of failed CCA and frames transmitted:
(Number of backoffs=Frames Transmitted + Failed CCA).
Each packet transmission is followed by radio turnaround time, ACK packet and IFS, so time spent in backoff is the simulation time removing the packet transmission time, radio turnaround time, ACK, IFS, and the beacon transmission time:
Time spent in backoff + CCA = Simulation Time-Beacon Transmission Time-{Frames Transmitted*(Frame Transmission Time + Turnaround Time + ACK Time + IFS)}
Average of βi (set of sensors) gives the probability that a sensor attempts in a backoff slot.
Discard probability. Probability of packet being discarded:
Pdiscard = Frames discarded/Frames transmitted (ignoring retransmission)
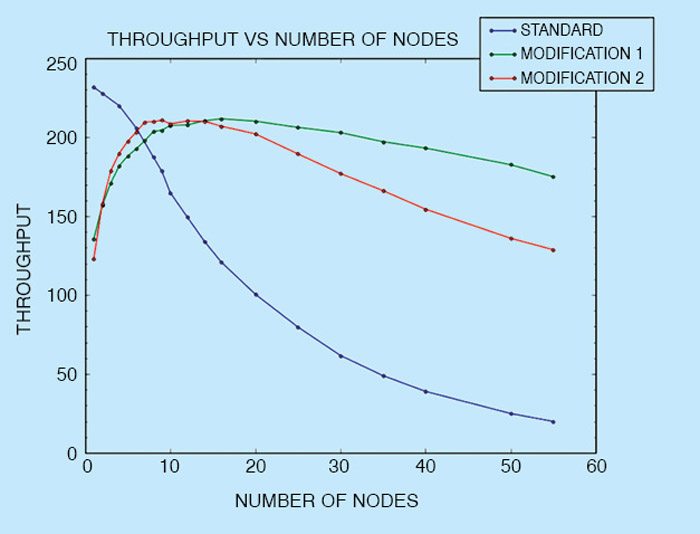
Payload and plots. Payload at application layer is 4 bytes. Overheads are set according to the standard (20IP+13MAC+6PHY). Using the Metrics.txt files obtained from the simulations, graphs are plotted. Below is an example:
Simulations are done in different scenarios for various nodes. Using Python’s matplotlib module, you can plot a throughput plot.
From the plots, you can see that change in the backoff parameters (backoff multiplier and backoff exponent limits, i.e., macMinBE and MaxBE) leads to a higher throughput than with the 802.15.4 standard. As the attempt rate (β) increases, probability of a packet collision increases and so throughput decreases. Change in the backoff parameters decreases the attempt rate (β), as we notice in the plots, and therefore the collisions decrease leading to a higher throughput. This decrease in collisions is evident from the discard probability graphs.
These simulation results validate the theoretical analysis of improved throughput (see Fig. 1) with modifications to the 802.15.4 standard’s back-off parameters.