




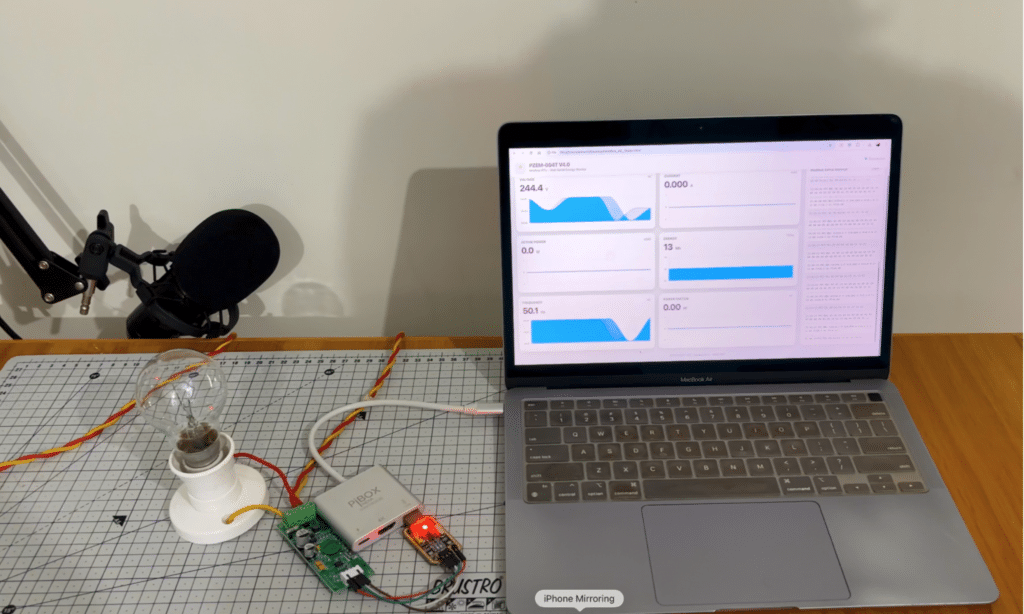
This Modbus RTU energy meter design is a low-cost, portable AC power testing and monitoring device that directly measures voltage, current, power, energy, frequency, and power factor. It can measure up to 10A using the PZEM-004T (V4.0) 10A sensor and can be extended up to 100A using the 100A sensor version. The major advantage is that no intermediate MCU is required. The sensor is connected directly to the power line and load, while a simple USB-to-TTL converter connects the device to a laptop. The Modbus data is decoded directly in the browser using Web Serial, allowing the user to view live readings, real-time graphs, raw Modbus data, and also record measurements with timestamps. The complete setup can be built for approximately ₹500 (US$5), making it a simple and affordable solution for testing, measurement, and monitoring.
Video Tutorial:
What is Modbus RTU?
Modbus RTU is a serial communication protocol widely used in industrial automation and electrical monitoring systems. It allows different devices such as energy meters, sensors, PLCs, VFDs, temperature controllers, power meters, and industrial controllers to communicate with each other using a standardised data format.
Modbus RTU normally communicates over RS-485 and uses a master–slave architecture. A master device sends a request containing the device address, function code, register address, and the data required. The connected device responds with the requested measurement data. Each message also contains a CRC (cyclic redundancy check) to detect communication errors.
For example, a power meter can store voltage, current, power, energy, frequency, and power factor in different Modbus registers. A computer, PLC, or industrial controller simply requests those registers and converts the returned values into meaningful measurements.
Bill of Materials for Modbus RTU Energy Meter
| ID | Component | Designator | Description | Quantity |
| 1 | AC Load | A | Bulb/Fan any AC appliance under 10A Peak Current | 1 |
| 2 | AC Power Wires | W | 12 AWG AC Power Wire | – |
| 3 | USB-TTL Serial Module | U1 | USB-TTL CH304G MODULE | 1 |
| 4 | PZEM-004T (V4.0) 10A | U2 | PZEM-004T-10A | 1 |
| 5 | AC Power Connector | U3 | AC Power Line Source | 1 |
Caution!
Be very careful when working with AC power lines. Make sure all connections are correct and that there are no loose wires or exposed connections. Also, cross-check the version of the PZEM-004T sensor, as the output pin configuration may vary between newer and older versions, as well as the 100A version. Always verify the pin configuration of your specific module before making the connections.
Circuit
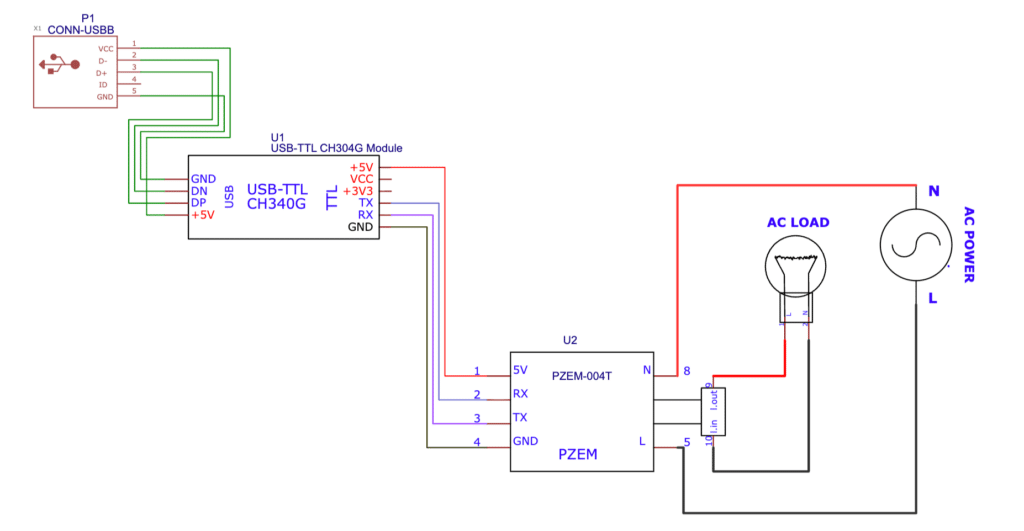
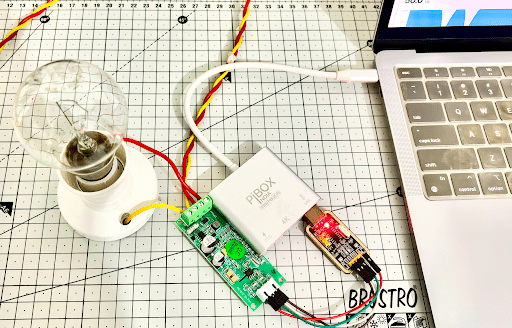
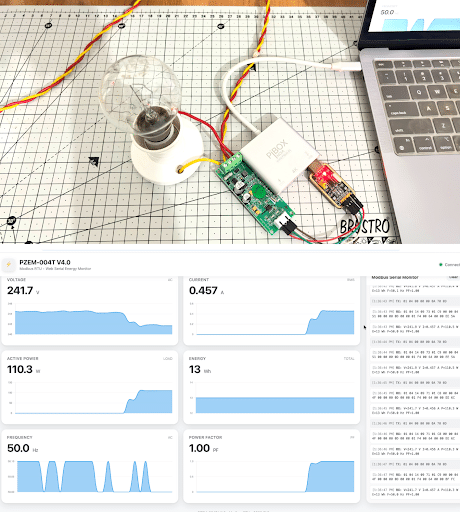
The beauty of our current design is that it is very simple and does not require any intermediate MCU for data collection or conversion. The AC power line can be directly connected to the PZEM-004T module, and the load can be directly connected to the output/load pins. The output data pins are connected to a USB-to-TTL module, which can be plugged directly into the laptop or computer system. Our design is ready to use! You can connect all the components as shown in the circuit design.
Web App
For Modbus data decoding and visualisation, a dedicated web app has been created. You can download the web app and open it in Google Chrome or another browser that supports Web Serial. The web app connects directly to the device through the USB-to-TTL interface, sends Modbus commands to fetch the sensor data, and decodes and visualises the measurements in real time. The dashboard displays live values along with real-time graphs for easy monitoring. It also allows you to record the measurement data in CSV format and download the recorded data with timestamps. Therefore, the web app not only provides real-time monitoring and visualisation but also works as a simple data-logging tool for testing and analysis.
Testing
Download the web app and open it in Google Chrome or another browser that supports Web Serial. First, power the AC load and make sure all connections are secure. Then connect the USB-to-TTL module to your laptop or computer and click ‘Connect’ in the web app. Select the correct USB serial port from the list, and the dashboard will start displaying the sensor data in real-time.
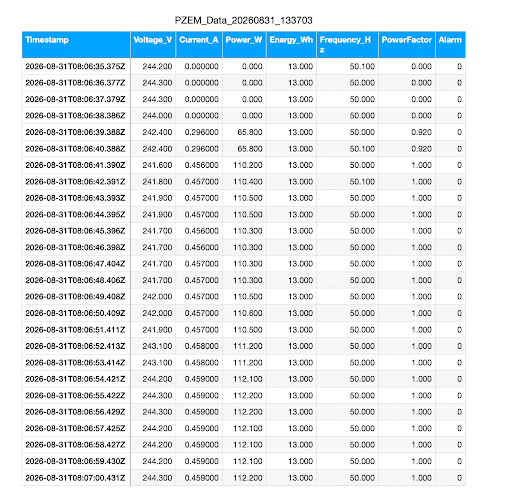
To record the measurements, click ‘Record Data’. The web app will continuously record the sensor readings with timestamps. Click ‘Stop’ when you want to finish the recording, and the recorded data will automatically be downloaded as a CSV file. You can open the CSV file in Microsoft Excel, Google Sheets, or any spreadsheet software to view and analyse the recorded measurements.
The device provides multiple electrical parameters together in real-time, including power factor, power consumption, current, voltage, frequency and energy, making it useful for quick testing, monitoring and analysis of AC electrical loads.