


Read Part 1
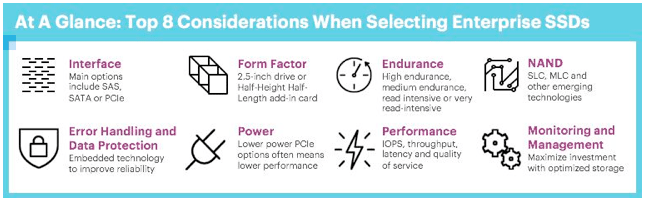
Form Factors
Both SATA and SAS devices come in 2.5” disk form factors. Until recently, PCIe devices were only available in the Half-Height, Half-Length (HH-HL) card form factor, meaning that the buyer would have to open up the server to install the SSD. This has changed in recent months. Almost all server vendors now offer machines where PCIe Flash can be accessed in the front of the server just like a traditional hard drive. Adoption of this server and storage combination is growing rapidly as it allows simple maintenance (like hot-swap) and gives customers the choice of easily adding or changing SSDs as needed.
Endurance Considerations
SSD endurance is usually described in terms of Drive Writes per Day (DW/D). Specifically, this is how much data that can be written to the device for a specified time period (typically three years or five years). For many vendors, this time period is the same as the SSD’s warranty period. But this is not always the case, so understanding the definition of DW/D is important. For example, if a 1TB SSD is specified for 1DW/D, it should handle 1TB of data written to it every day for the warranty period.
It is important to pay close attention to how DW/D is presented. Some vendors show DW/D in a best case scenario using Total Flash Writes. This is very different from measurements that use Application Writes. The latter takes into consideration worst-case, small block (4K) random I/O patterns with all device activities including writes, reads, wear leveling and garbage collection. It is common to hear about “Write Amplification” which is a reference to the realistic view of what happens over time when writing to an SSD. Other considerations like random or sequential writes will have an impact on endurance. The above reference is for random writes, which will yield lower endurance than sequential writes.
Another metric that is used for SSD write endurance is Terabytes Written (TBW), which describes how much data can be written to the SSD over the life of the drive. Again, the higher the TBW value, the better the endurance of the SSD.
Depending on the supplier, endurance may be reported as either DW/D or TBW. To convert between the two metrics, the drive capacity and the supplier measurement period must be known. To convert TBW to DW/D, the following formula can be used.
TBW = DWD * Warranty * 365 * Capacity/1024
Note: 1024 is simply the conversion for gigabytes to terabytes.
A few years ago, endurance was the top criteria for purchasing an SSD. What the industry has found over time is that SSD technology has improved and generally use-cases tend to be more read intensive. As such, there is now a broad mix of SSD endurance, capacities and DW/D annotations for High Endurance (HE), Medium Endurance (ME), Read Intensive (RI) and Very Read Intensive (VRI) along with associated DW/D warranties.
There are several good ways to choose the right DW/D for a specific environment’s needs. Options include vendor-supplied profiling tools or historical storage information with Self-Monitoring, Analysis and Reporting Technology (S.M.A.R.T.).
NAND Considerations
Endurance, footprint, cost and performance are all directly impacted by the underlying NAND technology used by the SSD maker. Early on, Single-Level Cell (SLC) NAND Flash, which uses a single cell to store one bit of data, was the primary choice as it provided high endurance for write intensive applications. The downside, however, was that SLC was extremely expensive. To allow the cost of SSDs to reach the mainstream, the industry moved to Multi- Level Cell (MLC) architectures. While less expensive, MLC also has lower endurance. Pioneering SSD vendors addressed MLC endurance challenges with specialized controller architectures for error handling and data protection, yielding Unrecoverable Bit Error Rates (UBER) of 1 error in 100,000 trillion bits read over the full write endurance of the device.
With broad adoption of MLC NAND today, the industry continues to seek new ways to reduce cost and expand the use cases for SSDs. To address both capacity and cost, a new technology is emerging called 3D NAND, where the NAND cells are arranged vertically in the NAND die to gain more density in the same footprint.
NAND manufacturers have chosen different paths for the construction of NAND cells. Some fabrications use traditional floating gate MOSFET technology with doped polycrystalline silicon. Others use Charge Trap Flash (CTF) where silicon nitride film is used to store electrons.
Floating gate is more mature based on its long history, but CTF may have advantages in certain areas. Enterprises should look to vendors with a strong track record of delivering high- quality and high-reliability to successfully manage the 3D NAND transition.
Error Handling and Data Protection
Every vendor addresses NAND management in a slightly different way with unique software and firmware in the controller. The primary objective is to improve SSD endurance through Flash management algorithms. Proactive cell management provides improved reliability and reduced bit error rates. State-of-the-art controllers also employ advanced signal processing techniques to dynamically manage how NAND wears. This eliminates the need for read-retries by accessing error-free data, even at vendor- specified endurance limits. In addition, techniques such as predictive read-optimization ensure there is no loss of performance during the useful life of the drive.
Some technologies also incorporate controller-based media access management, which dynamically adjusts over the lifetime of the media to reduce the Unrecoverable
Bit Error Rate (UBER). Advanced Error Correction Code (ECC) techniques enable a higher degree of protection against media errors, leading to improved endurance while maintaining or delivering higher performance.
From a data protection standpoint, certain SSDs can prevent data loss associated with Flash media. These products provide the ability to recover from NAND Flash page, block, die and chip failures by creating multiple instances of data striped across multiple NAND Flash dies.
Fundamentally, each NAND Flash die consists of multiple pages which are further arranged in multiple blocks. Data stored by the controller is managed at the NAND block level. Software in the controller is used to arrange data in stripes. When the host writes data to the SSD, redundancy information is generated by the controller over a stripe of data. The controller then writes the host data and the redundant data to the Flash stripes. Data in the
stripe is spread across the NAND Flash blocks over multiple Flash channels, so that no two blocks of data within a stripe resides in the same NAND block or die. The result is RAID-like protection of NAND that yields very high reliability.
Power Considerations
PCIe SSDs use more power than their SATA and SAS counterparts. High-end NVMe-compliant PCIe SSDs generally specify maximum power ratings for Gen-3 x4 around 25 watts. While there are “low-power” PCIe SSDs, they typically have lower performance characteristics than the high-end devices.
A few products on the market also offer field programmable power options that allow users to set power thresholds. As a lower power threshold can throttle performance, users should check with the manufacturer for proper power/performance tuning.
Measuring Performance
SSD performance typically is measured by three distinct metrics
– Input/Output Operations per Second (IOPS), throughput and latency. A fourth metric that is often overlooked but important to note is Quality of Service (QoS). Each is described below:
1. IOPS is the transfer rate of the device or the number of transactions that can be completed in a given amount of time. Depending on the type of benchmarking tool, this measure could also be shown as Transactions per Minute (TPM).
2. Throughput is the amount of data that can be transferred to or from the SSD. Throughput is measured in MB/s or GB/s.
3. Latency is the amount of time it takes for a command generated by the host to go to the SSD and return (round trip time for an IO request). Response time is measured in milliseconds or microseconds depending on the type of SSD.
4. QoS measures the consistency of performance over a specific time interval with a fixed confidence level or threshold. QoS measurements can include both Macro (consistency of average IOPS latency) and Micro (measured command completion time latencies at various queue depths).
Performance measurements must be tied to the workload or use case for the SSD. In some cases, block sizes are small, in others they are large. Workloads also differ by access patterns like random or sequential and read/write mix. A read or write operation is sequential when its starting storage location, or Logical Block Address (LBA), follows directly after the previous operation. Each new IO begins where the last one ended. Random operations are just the opposite, where the
LBA is not contiguous to the ending LBA of the previous operation. SSD controllers maintain a mapping table to align LBAs to Flash Physical Block Addresses (PBA). The algorithms employed by different vendors vary and have a big impact on both performance and endurance.
The mix of read and write operations also impact SSD performance. SSDs are really good at reads since there are very few steps that the controller must take. Writes on the other hand are slower. This is because a single NAND memory location cannot be overwritten in a single IO operation (unlike HDDs that can overwrite a single LBA). The number of write steps depends on how full the device is and whether the controller must first erase the target cell (or potentially relocate data with a read/ modify/write operation). Overall, SSDs can deliver very high IOPS in small random read access patterns and high throughput with large block sequential patterns.
IOPS and Throughput
Nearly all SSD data sheets will specify IOPS performance using 100% read or 100% write at 4K block sizes, as well as throughput specifications on 100% sequential reads and writes with a 128KB block size. These numbers make SSDs look extremely fast, and vendors tune their controllers to optimize the results. However, an application that is 100% read is quite unusual. A more relevant metric of the “real world” is a mixed read/write workload.
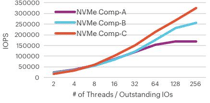
It is fairly rare to see published specs on mixed read/ write performance. It is even more uncommon to see mixed workload measures as thread count or user count increases. But this type of measurement is critical as it illustrates the robustness of controller design and how much work a given SSD can perform, allowing users to accurately plan the number of SSDs (and potentially servers) needed. Highlighted in Figure 3 to the right is an example of different NVMe vendor device IOPS in a 70/30 read/write mix as workloads increase.
As shown in Figure 3 most SSDs perform well under light workloads but as the load increases, only a few can scale in a linear fashion. In fact, the difference between NVMe Comp-A and NVMe Comp-C is 2x.
Latency
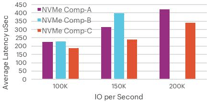
User experience, CPU utilization, number of CPU cores and ultimately the number of software licenses and servers required for an application are all driven by a combination of IOPS, throughput and latency. Of these three metrics, latency has the greatest impact. As the unit of measure for response time, being able to view latency over increasing workload demand should be a driving factor in selecting a SSD. Most vendors will publish an average latency metric on their data sheets. However, just like the 100% 4K random read metric, this number must be put into a workload context. Figure 4 illustrates how several vendors stack up on a more realistic scenario measuring throughput of a 4K random 70/30 mixed read/ write workload. (Contd.)
Continue Reading Part 3