


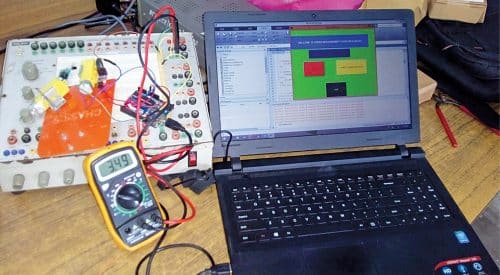
 You can now get samples of real-time speed of a DC motor in MS Excel format using a MATLAB Graphical User Interface (GUI). The variations in motor’s speed are also plotted automatically at the end of data acquisition. The GUI communicates with an Arduino that is interfaced with the speed sensor. The authors’ prototype of the project is shown in Fig. 1.
The major components used and their function in this project are described below.
Speed sensor
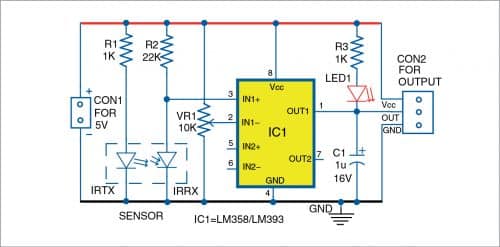
The opto-coupler type speed sensor module used here generates square wave of a specific frequency, which is a function of the speed of motor. Opto-coupler module FC-03 was used during testing. The internal circuit diagram of this speed sensor is shown in Fig. 2.
Coded disc encoder
It has a certain number of holes that help the speed sensor to generate a square wave of specific frequency. A 20-hole coded disc encoder was used for prototype.
Arduino Uno board
Arduino Uno is an AVR ATmega328P microcontroller based development board with 6 analogue and 14 digital I/O pins. The microcontroller has 32kB ISP flash memory, 2kB RAM, and 1kB EEPROM. It can operate at a clock frequency of 16MHz. The board provides capability of serial communication via UART, SPI, and I2C. Its digital pin no. 2 is used for detecting pulses from the speed sensor.
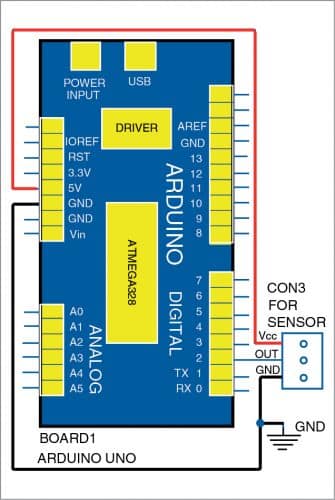
The square wave generated by the sensor module is available at digital pin no. 2 (interrupt pin INT0) of the Arduino. The DC motor’s speed is checked every ten seconds. Since the disc has 20 holes, the speed (in rpm) =(pulse*6)/20. This calculation is performed by the Arduino, which then sends the sensor data to the GUI. The sensor-Arduino interfacing is shown in Fig 3.
Software
Two different software programs are used in this project for the Arduino and the GUI.
The major functions used in the program for Arduino (spdm_matlab.ino) are:
- Serial.begin(9600) that initialises the serial port with a baud rate of 9600.
- attachInterrupt(0,counter,FALLING) that calls the interrupt handler ‘counter’ whenever a signal connected to interrupt pin (INT0) of the Arduino makes a high-to-low, that is, falling-edge transition.
The GUI application program (speedmeasure.m) is developed using R2014a version of MATLAB. The ‘Legacy MATLAB and Simulink Support for Arduino package’ must be installed. The procedure for installation of the package is described in detail in ‘Simulink Model For Real-Time Logging Of Process Data In MATLAB Workspace’ DIY project published in September 2020 issue, which is also available on EFY website at this link. The PC must have MS Excel or equivalent application like OpenOffice installed prior to running this program.
Follow the steps below:
1. Edit the COM port number in the line number 85: a=serial(‘com3’,’BaudRate’,9600); with the corresponding port number in your PC where the Arduino board is connected. You can also change the MS Excel file name and location from line number 108: xlswrite(‘D:\spdm2.xlsx’,z’,’Sheet1’);
2. Open the MATLAB program and click on the ‘Run’ button.
3. On pressing ‘START’ button in the GUI, MATLAB will try to establish communication with the Arduino. A screenshot of the GUI is shown in Fig. 4.
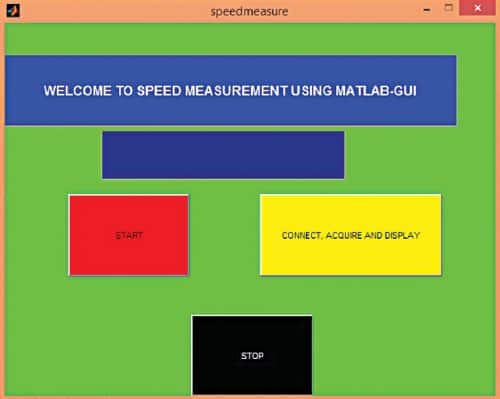
4. After a successful connection is established by MATLAB, you can click the ‘Connect, Acquire and Display’ button. MATLAB will start acquiring the speed sensor data from Arduino.
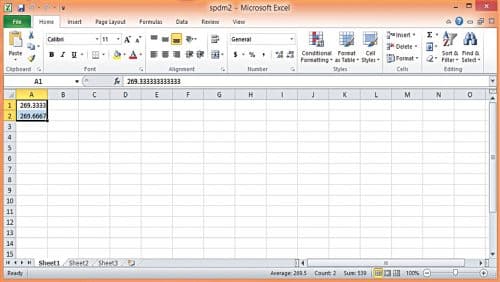
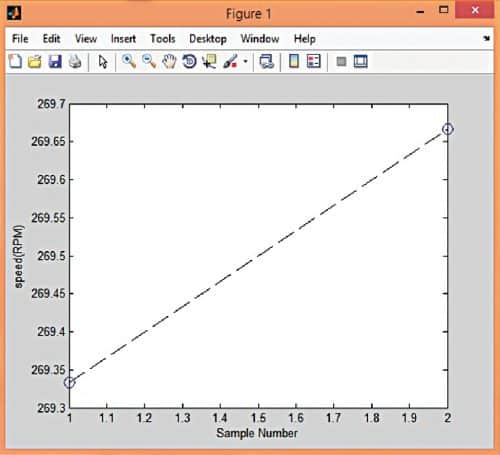
At the end of data acquisition, the program stores/saves these sample values column-wise in an Excel sheet and also displays these in the graphical window of MATLAB. A screen shot of the speed (in rpm) data logged in MS Excel is shown in Fig. 5. The plot of motor speed with respect to each sample acquired by the Arduino is shown in Fig. 6.
Download Source Code
Shibendu Mahata is M.Tech (gold medalist) in instrumentation and electronics engineering from Jadavpur University. He has contributed over 20 papers in the domain of signal processing in reputed international journals, conferences, and book chapters
Souvik Kumar Das is passionate about electronics and MCU-based system design