
 This project is used to detect colours and display the colour names on an LCD using the TCS3200 colour sensor module and Arduino board. The sensor outputs red, green, and blue colours’ reflected light values using colour tinted photodiodes. The colour output comes as a frequency, and the value depends on the intensities.
Theory of colour identification
To understand what the eye perceives as a particular colour, the signals received by the eye are classified into red, green, and blue, denoted by the name tristimulus values. The tristimulus values of any particular colour are the three components of R, G, and B. The sensor that we use also provides signals similar to the tristimulus values.
From the values of R, G, and B received as Vr, Vg and Vb, one has to calculate two values known as ‘chromaticity coordinates.’ The formula for the calculation of these two x and y coordinates was introduced by the International Committee on Illumination or CIE in 1931.

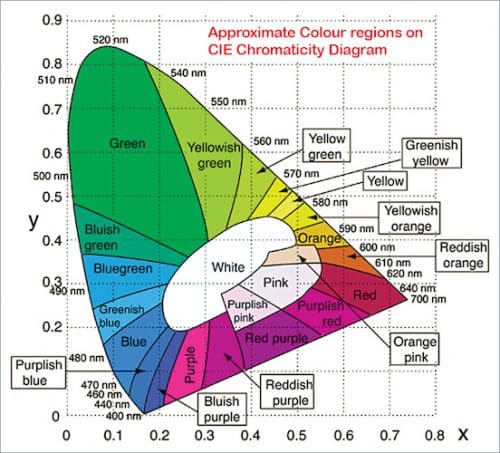
This committee, after taking the readings of thousands of visual observers with varied colour objects, arrived at a chart known as the Chromaticity chart, shown in Fig. 1. From the calculated x and y coordinates, the colour can be determined by plotting this (x, y) point in the chart.
x=Vr/(Vr+Vg+Vb)
y=Vg/(Vr+Vg+Vb)
For instance, x=0.2 and y=0.35 gives bluish-green colour and x=0.47 and y=0.45 gives yellow colour. The chart has a horseshoe shape, which is peculiar but is the result of an exhaustive study by CIE. The edge of the chart shows the purest of colours with the spectral wavelength values shown on certain points noted therein.
For instance, blue starts at 400nm, green ranges between 500 and 540nm, yellow at 575nm, and red at 640nm.
The complementary colours, including purple and magenta, are at the bottom of the chart. The white region shown at the centre is the approximate range of white colour, though some colours have coordinates falling within this white elliptical region also. The chart is precise, but the diagram shown here with demarcations between colours is only approximate.
Thus, the curved lines shown distinguishing, say green and yellowish green, are only approximate. In this chart, the main colours are seventeen in number. Therefore the circuit and program in this article are meant for identifying up to twenty-two colours including complementary colours.
Circuit and working
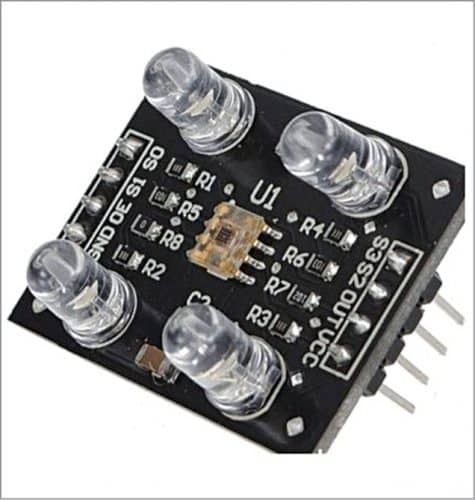
The circuit diagram for colour identification is shown in Fig. 2. It is built around an Arduino Uno board (Board1), 16×2 LCD (LCD1), TCS3200 colour sensor module (CS), and a few discrete components. TCS3200 colour sensor module is shown in Fig. 3.
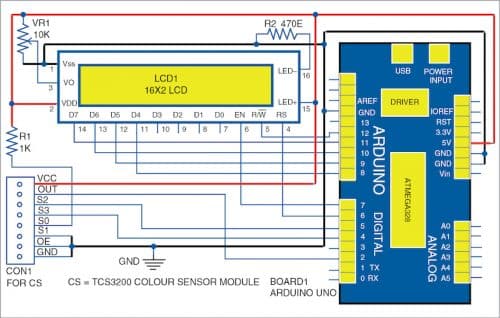
The circuit shown uses the frequency output. The external interrupt pin INT0 (pin 2) of Arduino is used to count the frequency values. We have selected 10kHz as the maximum range. Pins S2 and S3 select colours in the order of 00, 11, and 01. Only the so-called tristimulus values of red (R), green (G), and blue (B) are available. The details of the colour sensor module were already published in ‘RGB Colour Detector Using TCS3200
Sensor Module’ DIY article now available at this link.
The three frequency values are used to determine the chromaticity coordinates and thereby identify one among 22 classified colours from the CIE chromaticity chart using our search algorithm. The chromaticity coordinates (multiplied by ten) are indicated for every object along with the nearest colour name as per the colour demarcated CIE chart (Fig. 2). These R and G values are used for colour matching.
An LCD is interfaced to the Arduino board to show both the coordinates R and G and the colour name. The R and G are used for colour matching as two identical coloured objects will have similar values.
The circuit is also interfaced with a two-row character LCD display. Pin 3 of LCD is connected to a 10-kilo-ohm (VR1) potmeter to adjust the voltage between 0 and 5V for varying the contrast of the characters shown on the LCD module.
The data comprises four wire connections to pins D4 through D7 of the LCD (11-14). Pin 15 is connected to +5V and used for the backlight of the LCD, and pin 16 is grounded via resistor R2.
Here, we have used a four-wire data connection rather than the eight-wire data connection. Therefore the program has to send the command and address values in two sequential write operations. Using four-wire connection saves pins on the microcontroller.
The yellowish objects being detected and displayed on the LCD, along with the values of the signals, are shown in Fig. 4.

Programming the chip
The program (colour_sense.bas) for the unit was developed on Oshon AVR Simulator IDE. The software is helpful for developing the project.
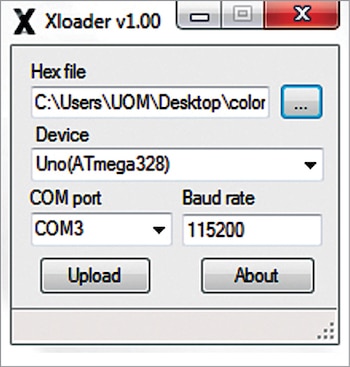
After the coding (written in BASIC) is done, compile the code or load the hex file generated into the ATmega328P chip on the Arduino Uno board. The Xloader program is used to load the hex file. When the Xloader program is executed, a window will open up, as shown in Fig. 5. Specify the COM port number for the USB socket to which the Arduino Uno board is connected. This number can be found from the ‘Device Manager’ on Windows on the PC/Laptop.
Browse the hex code from XLoader window as shown in Fig. 5, and press upload button. After loading the code, disconnect the Arduino board from the laptop and connect a 9V adaptor to its DC socket (or a 5V supply to its 5V and ground pins).
Construction and testing
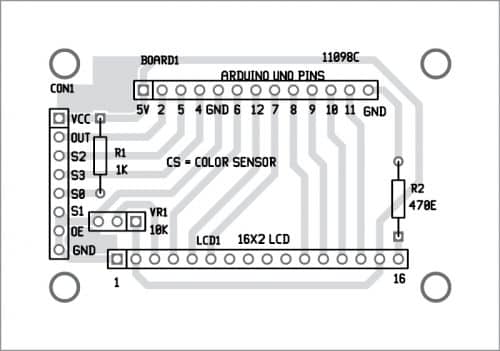
A PCB layout for colour identification is shown in Fig. 6 and its components layout in Fig. 7. After assembling the circuit on the PCB, enclose it in a suitable box. Fix the sensor module and LCD on the front panel and connect the wires to their respective connectors on the PCB.
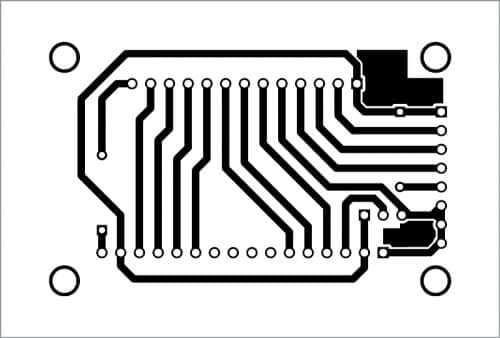
Download PCB and Components layout PDFs: click here
Download Source Code
When you switch on power and place any coloured object in front of the sensor, the name of the colour along with its chroma value will be displayed on the LCD. Make sure that the sensor is not directly exposed to the surrounding light source to avoid false detection.