


 Weather forecasts play an important role in our day-to-day life. A good Weather-Forecast Monitoring System helps in better planning and any preparations that may be required in case of adverse weather.
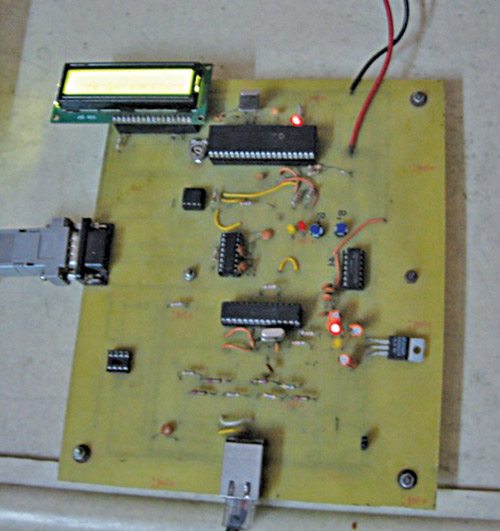
This Weather-Forecast Monitoring System project deals with the construction of a weather display system using low-cost components so that any electronics hobbyist can build it. Instead of using sensors to gather weather data, the project gets information from professional weather stations located around the world through an international weather data provider. The author’s prototype is shown in Fig. 1.
World weather online
During the past few years several weather data providers have proliferated on the Internet. One such provider is worldweatheronline.com. It offers a free application programming interface (API) that can be used by the developers to get the weather data. A client device is needed to access the worldweatheronline.com API to get weather data by sending a uniform resource locator (URL), simply known as the Internet address.

 In order to get access to the API one has to register with the weather website. Upon successful registration, a unique access key code is assigned and sent to your email ID. This unique code must be included with the request URL that is sent to the server. One can send approximately 500 requests per hour to the server. The server accepts the client device request and sends the necessary data to the client.
The server provides three types of message formats for weather data: XML, JSON and CSV. The first two formats are a bit difficult to use because one must use format headers and keep track of special string of characters to identify data. The CSV format is simple because it uses readable characters where the data is separated by a comma (,) character.
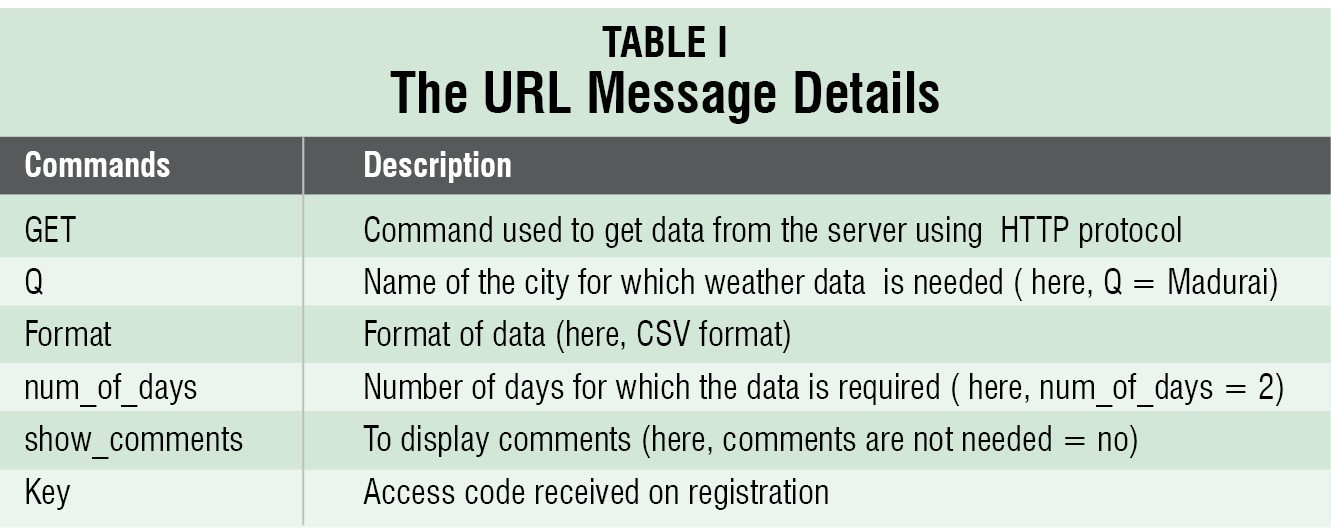
To request weather data, the URL message shown below is sent to the server.
“GET/free/v1/weather.ashx?q=madurai&format=csv&num_of_days=2&show_comments=no&no&key=yayjgrdysb6hpftc2jwek5c9”;
The response to the URL message is a stream of readable characters that include HTTP protocol information followed by weather data. The HTTP protocol information contained in the weather data is removed by a routine in the client software. The data values that follow are separated by commas. The current data and the forecast are separated by line feed and carriage return. The data layout information is available as comments in the CVS format. The following is an example of response from the server that contains weather data header in CSV format:
HTTP/1.1 200 OK
Cache-Control: public, no-cache=”Set-Cookie”, max-age=120
Content-Type: text/plain; charset=utf-8
Expires: Tue, 14 Jan 2014 06:20:17 GMT
Server: Microsoft-IIS/7.5
Set-Cookie: wwoanon=BameQIJHzwEkAAAANDc0NGEwZmEtOTY5ZC00MzFlLThhNzItNWMzNWQzMWZl
NmQ27xVhqIEhtREITXXX7wBw3Pa5XkM1; expires=Mon, 24-Mar-2014 16:58:17 GMT; path=/;
HttpOnly
X-AspNet-Version: 4.0.30319
hit-for-pass: 1
Date: Tue, 14 Jan 2014 06:18:19 GMT
Age: 0
Connection: close
X-Powered-By: UKFastWebcelerator
X-Cache: MISS

The following is the CSV data format:
date,tempMaxC,tempMaxF,tempMinC,tempMinF,windspeedMiles,windspeedKmph,winddirDegree,winddir16Point,weatherCode,weatherIconUrl,weatherDesc,precipMM
06:18 AM,29,116,http://cdn.worldweatheronline.net/images
wsymbols01_png_64/wsymbol_0002_sunny_intervals.png,PartlyCloudy ,10,16,37,NE,0.0,60,10,1015,40 2014-01-
14,30,86,21,70,11,17,37,NE,116,http://cdn.worldweatheronline.net/images/wsymbols
01_png_64/wsymbol_0002_sunny_intervals.png,Partly Cloudy,0.1
2014-01-15,31,88,21,70,9,14,30,NNE,116,http://cdn.worldweatheronline.net/images/
wsymbols01_png_64/wsymbol_0002_sunny_intervals.png,Partly Cloudy,0.1
The client software
The TCPIP client board, which houses Microchip TCPIP Stack 5.42, is configured to work as client. More detail on the stack can be obtained from www.microchip.com website.
The general TCP Client.c file available in stack is suitably modified to carry out the following tasks:
- Send required URL to the server
- Remove the HTML header from the incoming weather data from the server
- Store weather data in the EEPROM
- Send the stored data from the EEPROM to the host PC via COM port
Circuit and working
The block diagram of weather forecast monitoring system is shown in Fig. 2 and circuit diagram of the client board is shown in Fig. 3. The circuit contains Microchip PIC18F4685 (IC1), Ethernet controller ENC28J60 (IC2), EEPROM 25LC256 (IC3), quadruple 3-state buffer 74HCT125 (IC4), dual driver/receiver MAX232 (IC5), 16×2 LCD display and magnetic jack RJ45 Ethernet connector.
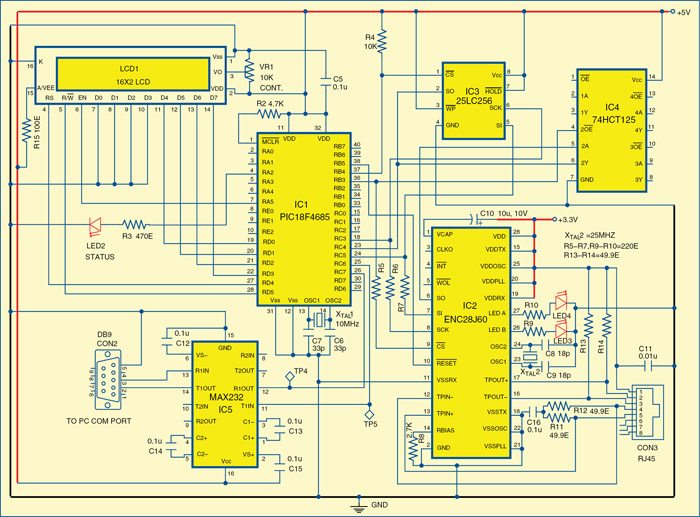
Ethernet controller ENC28J60 operates with 3.3V supply, so level-shifter IC 74HCT125 is used to maintain proper TTL levels between PIC and ENC via SPI bus. LCD is wired in a 4-bit mode with data lines connected to port pins RD0 through RD3 of the microcontroller IC1. The control lines RS, R/W and EN are connected to RD4, RD5 and RA5. Status LED2 connected to RA2 is used to indicate working of the stack by blinking.
Pins RC3, RC4 and RC5 are used for SPI communication. Pins RC6 and RC7 are used as TX and RX lines for serial communication. Dual driver/receiver MAX232 provides necessary voltage levels for serial communication between the PC and the client board. RB3 and RB4 pins act as CS lines for the ENC and EEPROM, respectively. Pin RB5 acts as reset line for ENC28J60. EEPROM 25LC256 is used for storing incoming weather data.
The client board should be connected to the Internet through Ethernet port of the modem or router.
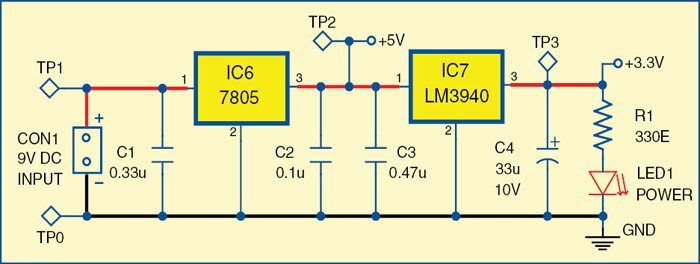
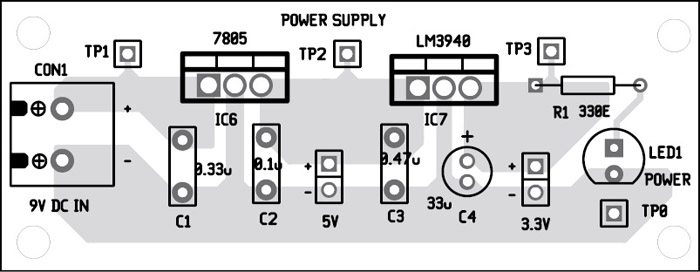
Power supply. The client board circuit is powered by 5V and 3.3V supplies (refer Fig. 4). A 9V DC supply is fed to the 5V regulator 7805 (IC6). This 5V supply drives LM3940 (IC7) and the other circuit including PIC18F4685 microcontroller, LCD display and level shifter 74HCT125. LM3940 is a 5V to 3.3V converter. ENC28J60 is powered by the 3.3V supply. LED1 is used to indicate the presence of power in the circuit.
Host software
The host software is developed using Delphi language, which is simple to use and does not require DLL files like VB for running its application exe. The Delphi exe file can run on any windows platform. Delphi front panel view of the weather monitor is shown in Fig. 5.
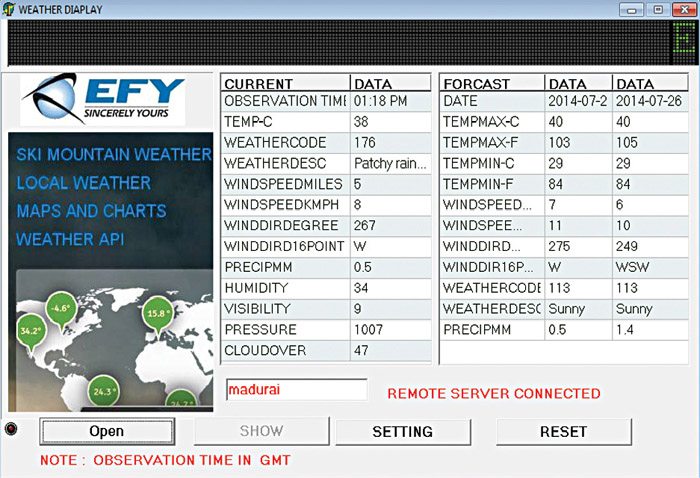
The Setting button at the screen’s bottom is used to configure the COM port parameters such as port number and baud rate. The Open button opens the relevant COM port, sends City Name in the edit box window and character ‘S’ to the client board which initiates the start of the client program. The Show button is enabled only after all the processing is over; it enables the user to view the data in the Report List. If a query is sent for a city whose weather data is not available, the server sends ‘Unavailable’ message to the client. That information is passed on to the user by displaying the message through a pop-up window.
Free third-party COM port library, SDL component Report List library and Scroll Message library are used, which are freely available on the Internet for download. The incoming CSV data format from EEPROM via COM port is stored in a string array. Simple software routines are included in the Delphi program to extract individual weather data from the CSV format and displayed in Report List.
Reset button is used to reset the Delphi form. The user has to change the COM port number available in his PC and baud rate is fixed to 19200.
Construction and testing
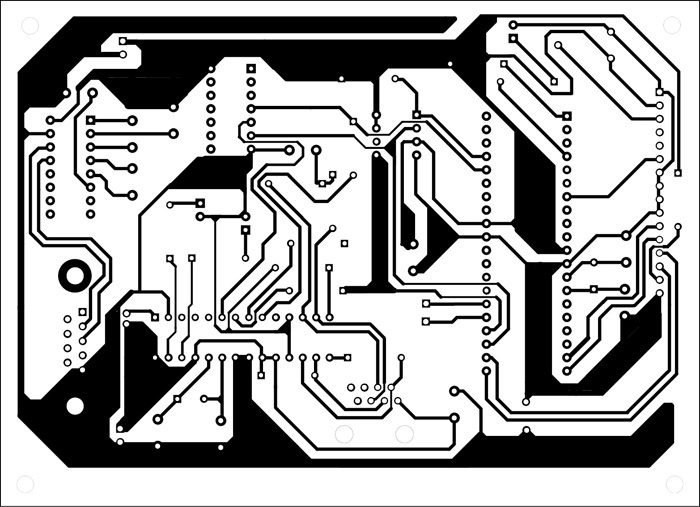
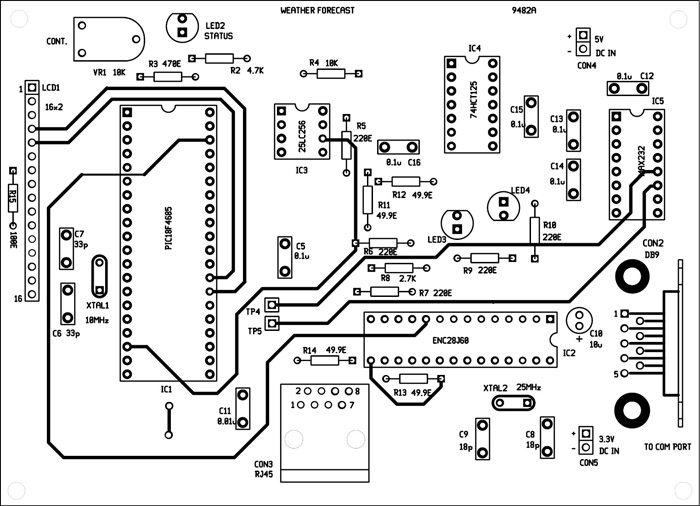
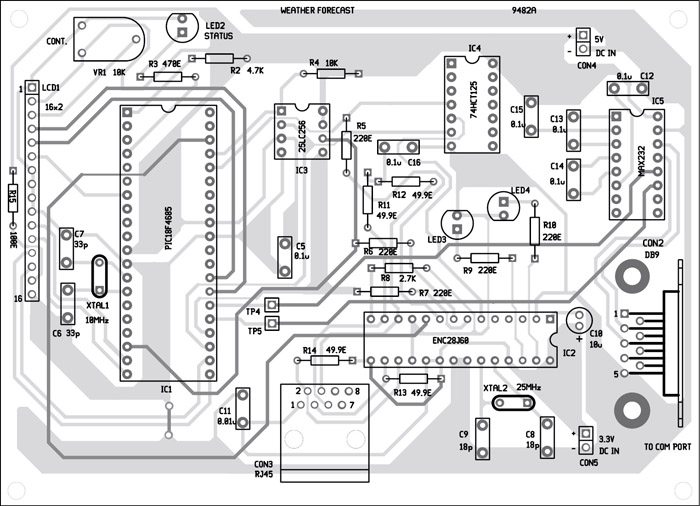
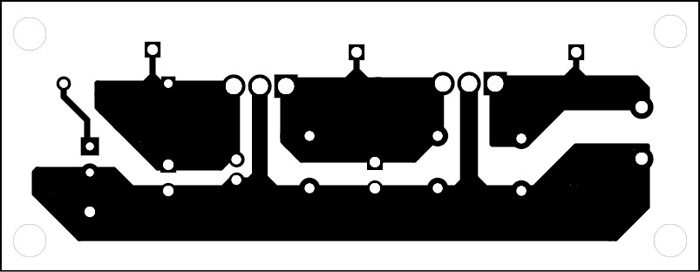
A double-side, solder-side PCB layout of the client-board is shown in Fig. 6, component-side track layout in Fig. 7 and the component layout in Fig. 8. An actual-size, single-side PCB layout for the power supply is shown in Fig. 9 and its component layout in Fig. 10.
Mount the components on the PCBs to save time and minimise assembly errors. Check proper connections before connecting the 5V and 3.3V supplies to the PCB at CON4 and CON5, respectively.
Download PCB Layout and Component Layout: Click Here
Download Source Code: Click Here
If your PC does not have a serial COM port, you can connect it to USB port by using a USB-to-serial converter. In that case, first you need to install appropriate driver in your PC. After connecting the client board to your PC, launch the weatherdisplay.exe Delphi program. A window screen will open up similar to the one shown in Fig. 5 with blank data columns.
In the display panel of this window click on the Setting button and choose the COM port. Note that your PC COM port baud rate should be 19200. Enter the city name in the edit box, for instance, Madurai. Now switch on the client board. The ‘TCP-Client’ message should appear on the LCD. Vary VR1 to adjust the contrast of the LCD to get clear visibility of the message.
Next connect one end of the Ethernet cable to the RJ45 connector in the client board and the other end to the Ethernet port of your broadband modem/router which has Internet connection. You need to configure your Internet connection in your PC from the control panel. You should disable wireless Internet connection. If Internet connection is successful, you will see the blinking of LED3 and LED4.
Now, click on Open button at the bottom of the screen. The IP address (192.168.0.102 in our case) should appear on the LCD. The Show button will be inactive first but after a few seconds it will get enabled and ‘Remote server connected’ message will appear at bottom of the screen. Upon clicking on the Show button weather data will get displayed in the report sheet as shown in Fig. 5.
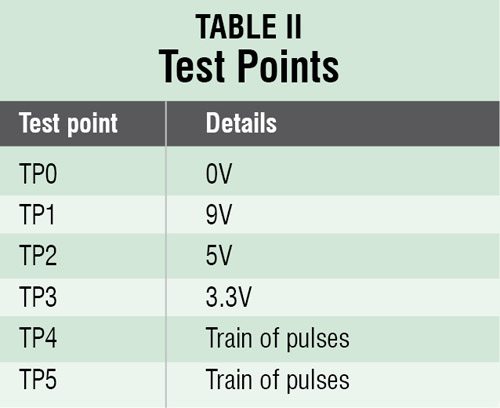
At any time, if you face any problem in the circuit, refer Table II for troubleshooting.
Further applications
Some other applications of this system could be:
- Apart from the weather data one can get different types of weather analysis by sending relevant URL request to the server by referring to the full document available on the website.
- It can be made into a portable system by interfacing it to a 10.2cm (4-inch) TFT colour LCD display and making it wireless using MR24WBOMA instead of ENC28J60
- This design may be better than a backyard weather station because you receive accurate professional weather forecasts.
- One can modify the design to connect with other data providers to display important data such as news headlines and stock market information.
The author, M. Kathiresan, is a retired sub-divisional engineer, mobile services, BSNL, Madurai, A. Robson Benjamin is an associate professor of physics at The American College, Madurai and C. Vijayan is an associate professor of physics at S. Vellaichamy Nadar College, Madurai. The authors thank worldweatheronline.com website moderators for providing free weather API for the project