


ECG, which stands for Electrocardiogram, is a medical test that measures the electrical activity of the heart over a specific period. The test is commonly known as an EKG (Electrocardiogram) in some regions. It is a non-invasive and painless procedure that involves attaching electrodes (small, adhesive patches with sensors) to the skin to record the heart’s electrical signals.
The electrical signals produced by the heart coordinate the heart’s muscle contractions, allowing it to pump blood effectively throughout the body. The ECG provides a visual representation of these signals, creating a graph known as an electrocardiogram. Each spike and wave on the graph corresponds to a specific event in the cardiac cycle.
In this project, we introduce an Ardunio-Python based monitoring system.
Components Used
We need the following components:
Hardware – Arduino uno, ECG Module (AD8232), connecting wires, ECG Electrode Connector -3.5 mm, ECG Electrodes – 3 pieces,
Software- Python 3.10.1, Tkinter, Matplotlib, Numpy.
ECG Signal:
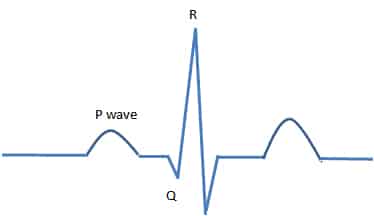
The ECG (Electrocardiogram) signal represents the electrical activity of the heart as it goes through its cardiac cycle. The nature of the ECG signal is characterized by a series of waves and complexes, each corresponding to specific events in the heart’s electrical activity. (See Fig. 1)Here’s a breakdown of the components of a typical ECG signal:
P Wave:
Represents the atrial depolarization (contraction).
It indicates the initiation of the electrical impulse in the atria.
QRS Complex:
Represents the ventricular depolarization (contraction).
The QRS complex is typically a larger wave on the ECG and reflects the electrical activity as the impulse travels through the ventricles.
T Wave:
Represents the ventricular repolarization (relaxation).
It follows the QRS complex and indicates the recovery of the ventricles.
PR Interval:
Represents the time it takes for the electrical impulse to travel from the atria to the ventricles.
QT Interval:
Represents the total time for ventricular depolarization and repolarization.
ST Segment:
Represents the interval between ventricular depolarization and repolarization.
It’s a flat, isoelectric segment that should ideally be at the same level as the baseline.
The ECG signal is typically recorded over a period of time, with each heartbeat producing a characteristic pattern. The signal is displayed on a graph, with time on the horizontal axis and voltage on the vertical axis. The duration and amplitude of each wave and complex provide valuable information about the heart’s health and functioning.
Detection of ECG Signal with AD8232:
The AD8232 is a single-lead, heart rate monitor front end integrated circuit (IC) that can be used for the detection of ECG (Electrocardiogram) signals. It is commonly used in DIY and prototyping projects for monitoring heart rate and ECG signals. Below are the general steps to detect ECG signals using the AD8232 with an Arduino:
Wiring:
- Connect the AD8232 to the Arduino using the following connections:
- GND pin on AD8232 to GND on Arduino
- 3.3V pin on AD8232 to 3.3V on Arduino
- OUT pin on AD8232 to an analog input pin on Arduino (e.g., A0)
- Connect the ECG electrodes to the corresponding pins on the AD8232:
- Right Leg Drive (RLD): Connect to a point on the right leg to provide a reference for the ECG signal.
- Left Arm (LA): Connect to the left arm electrode.
- Right Arm (RA): Connect to the right arm electrode.
- Left Leg Drive (LLD): Connect to a point on the left leg.
- Place the ECG electrodes on the body. Common placements are on the left and right arms and the left leg.
Arduino Code
void setup() {

// initialize serial communication at 9600 bits per second:

Serial.begin(9600);

}

// the loop routine runs over and over again forever:

void loop() {

// read the input on analog pin 0:

int sensorValue = analogRead(A0);

// print out the value you read:

Serial.println(sensorValue);

delay(1); // delay in between reads for stability

}
Software Installation and Running of the Project
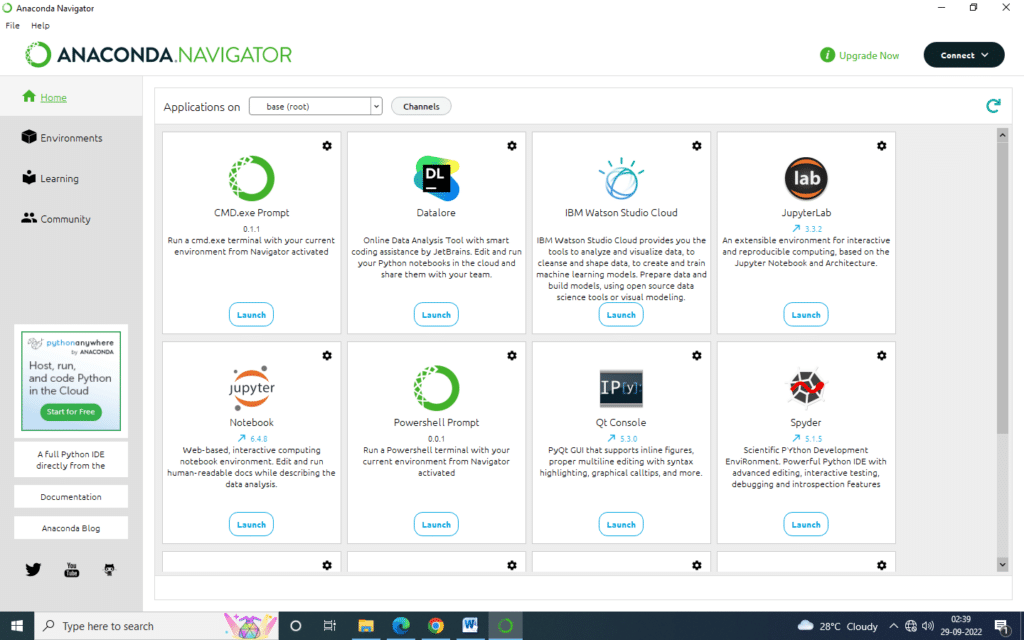
- Step 1: Install Anaconda Distribution for Windows. Anaconda is an open-source Python distribution platform. It installs Jupyter NoteBook, Spyder, R studio and other integrated development environments for Python.
- Step 2: Launch Jupyter NoteBook from Anaconda. It creates an interactive web based Python computing environment in any browser that is selected while installation.
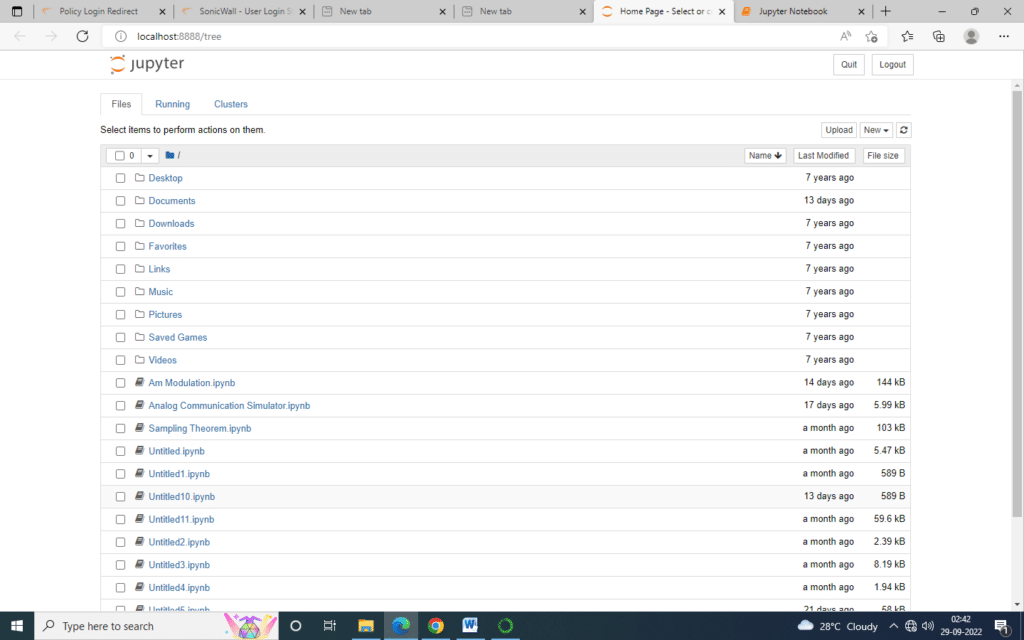
- Step 3: Create a new notebook from the file menu of Jupyter IDE by selecting Python 3 as ipykernal. Rename the new notebook as ‘ECG Monitor System”.
- Step 4: Import libraries: This project uses functions from Tkinter, Matplotlib, numpy libraries. Hence we import numpy, matplotlib, pyplot libraries. We can use pip install and conda install to install libraries.
- Step 5: This GUI Includes a window with canvas to plot ECG Signal and entry buttons to start and stop signal plotting
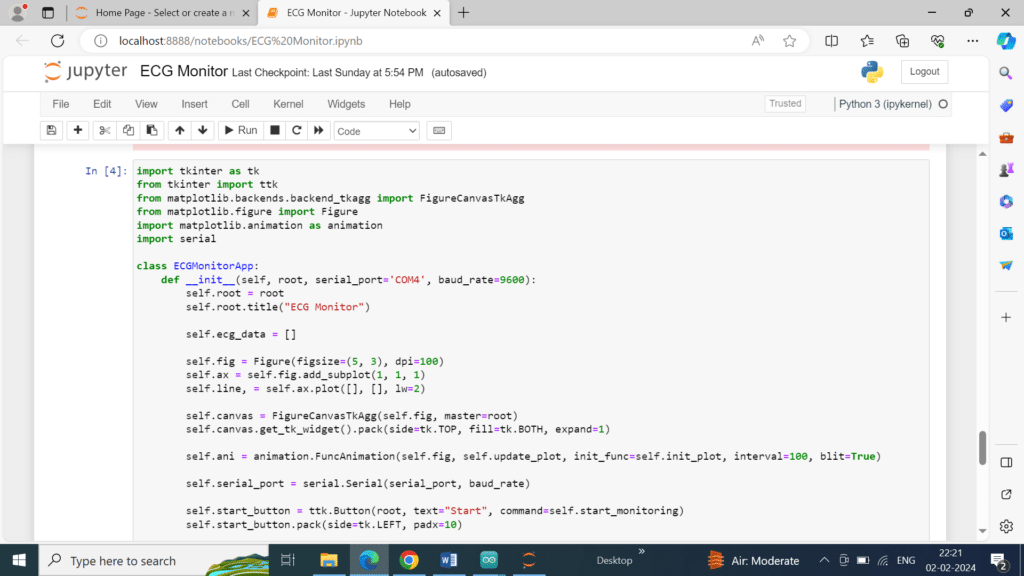
Python Code:
import tkinter as tk
from tkinter import ttk
from matplotlib.backends.backend_tkagg import FigureCanvasTkAgg
from matplotlib.figure import Figure
import matplotlib.animation as animation
import serial
class ECGMonitorApp:
def __init__(self, root, serial_port='COM4', baud_rate=9600):
self.root = root
self.root.title("ECG Monitor")
self.ecg_data = []
self.fig = Figure(figsize=(5, 3), dpi=100)
self.ax = self.fig.add_subplot(1, 1, 1)
self.line, = self.ax.plot([], [], lw=2)
self.canvas = FigureCanvasTkAgg(self.fig, master=root)
self.canvas.get_tk_widget().pack(side=tk.TOP, fill=tk.BOTH, expand=1)
self.ani = animation.FuncAnimation(self.fig, self.update_plot, init_func=self.init_plot, interval=100, blit=True)
self.serial_port = serial.Serial(serial_port, baud_rate)
self.start_button = ttk.Button(root, text="Start", command=self.start_monitoring)
self.start_button.pack(side=tk.LEFT, padx=10)
self.stop_button = ttk.Button(root, text="Stop", command=self.stop_monitoring)
self.stop_button.pack(side=tk.LEFT, padx=10)
def init_plot(self):
self.line.set_data([], [])
return self.line,
def start_monitoring(self):
self.ecg_data = [] # Clear previous data
self.ani.event_source.start()
def stop_monitoring(self):
self.ani.event_source.stop()
def update_plot(self, frame):
# Read ECG data from Arduino
ecg_value = int(self.serial_port.readline().decode().strip())
self.ecg_data.append(ecg_value)
# Update the plot
self.line.set_xdata(range(len(self.ecg_data)))
self.line.set_ydata(self.ecg_data)
self.ax.relim()
self.ax.autoscale_view()
return self.line,
if __name__ == "__main__":
root = tk.Tk()
app = ECGMonitorApp(root)
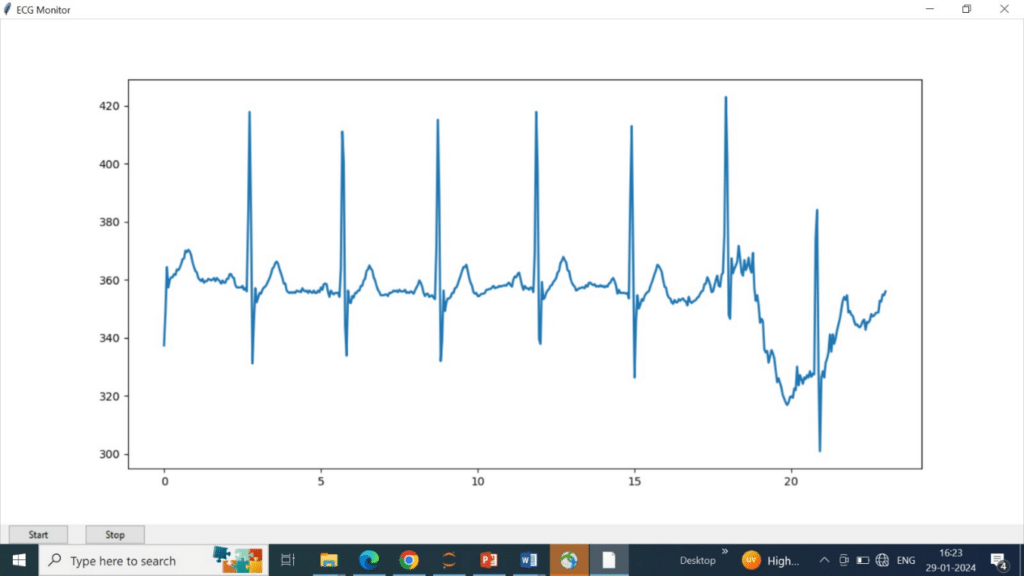
root.mainloop()Results: The ECG waveforms can be checked as follows
Troubleshooting:
- After uploading the code to Arduino disconnect it from the PC, and Close Arduino IDE program.
- Reconnect Ardunio to PC.
- Check the proper COM port in the device manager.
- Set Boud rate 9600 in ‘class ECGMonitorApp:’ in Python code.
- Run the Python code in Jupyter notebook