 We are all familiar with the earth images of clouds and hurricanes taken from the earth-orbiting satellites in our daily weather forecasts. With the modern technology and internet connectivity, now a days, such images are accessible to any individual at the click of a button, or even through apps on mobile phones. However, such images are provided either by government agencies or commercial outlets that offer greater details for the weather forecasters.
Often the images come from geostationary satellites that send the high-speed data at microwave frequencies in the range of 3 to 4GHz in C-band, or even higher frequencies. Thus, the actual antenna and RF electronics at these microwave frequencies is a limiting factor for a common experimenter. Besides special design skills and expertise in the RF and microwave domain, authorisation or licensing is also needed to receive such data or signals.
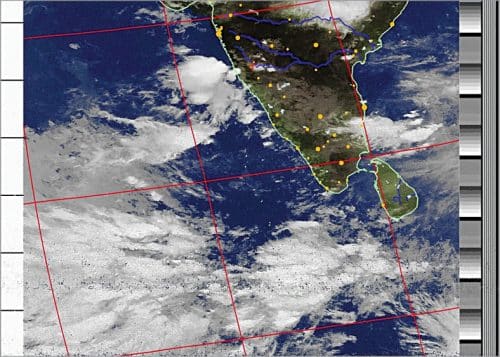
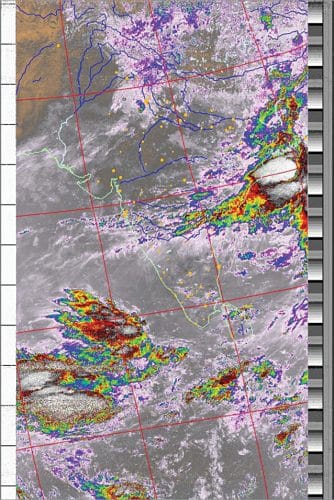
There are, however, some satellites that provide good-quality weather images of a particular location on earth, which can be freely used for one’s own good purpose. The images shown in Fig. 1 and Fig. 2 were received from such satellites. Although these are not very high resolution images, they are sufficient for keeping track of the weather and cyclones for an individual experimenter.


The present technology and software tools that are available as freeware can be used to set up one’s own weather satellite receiving station. This article will help you set up one such station for yourself.
The basic system
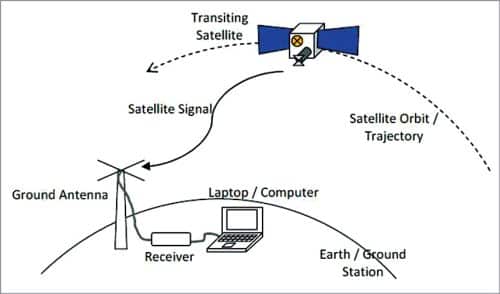
Let us first have a view of the basic system configurations and the type of satellites we can connect to for this purpose. Fig. 3 shows the basic block diagram of a satellite receiving station. Obviously, we need a good antenna, a receiver, and a computer to run the image decoding software. But what’s important is to know the satellites that can be used for this purpose. Let’s find out!

There are primarily, three types of artificial satellites that orbit the earth. Let us try to understand them.
GEO satellites
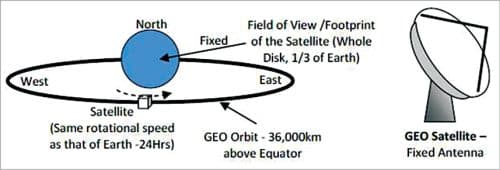
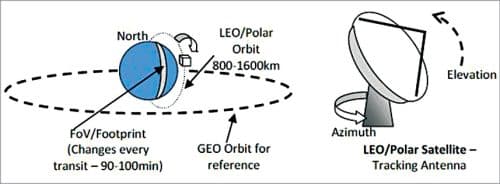
Geosynchronous Earth Orbit (GEO) satellites have an orbit of around 36,000km above the earth’s surface. These rotate at the speed of earth and thus appear to be stationary when viewed from earth. The GEO satellites cover one-third of the earth and are often equipped with very high resolution multi-spectral imagers operating in optical to microwave (radio) wavelengths. Since these satellites are stationary relative to earth, it is possible to use high-gain parabolic antennas on earth to receive their microwave signals (refer Fig. 4).
MEO satellites
Medium Earth Orbit (MEO) satellites have an orbit of 10,000 to 15,000km, in between the GEO and LEO satellites in height.
LEO satellites
Low Earth Orbit (LEO) satellites have an orbit of 800 to 1600km and are often non-stationary—or at least they orbit in the sun-synchronous polar orbits and typically have on orbital period of 90 to 100 minutes. Polar orbit and tracking antenna are shown in Fig. 5.
The National Oceanic and Atmospheric Administration (NOAA) of the USA operates a series of such polar orbiting weather satellites. Of prime focus for us are the NOAA-15, NOAA-18, and NOAA-19 that are currently operational. These satellites transmit low-resolution, typically 4km-per-pixel, 8-bit image data.
The signals are transmitted in what is called Automatic Picture Transmission (APT) protocol in an audible tone with standard frequency modulation (FM) at a carrier in the 137MHz band. All image data from the infrared and near-visible range imagers on-board these satellites is transmitted along with the necessary telemetry and sync signals in the same audio signal, and this is termed as Analogue Transmission. We shall receive the weather images from these satellites for this project.
A satellite from Russia, named Meteor-M-2, in the polar orbit transmits weather images at even higher resolution in the same 137MHz band. But it uses digital QPSK modulation, so requires a special demodulator to reconstruct the images from the digital data transmission.

Practical system build-up
Antenna
As stated earlier, the satellites we are interested to receive are the NOAA-15, NOAA-18, and the NOAA-19 that transmit the images on 137MHz VHF band with a frequency modulated (FM) audio information using the APT protocol. Details about this protocol are given in later part of the article.
NOAA-15 transmits at 137.6200MHz, NOAA-18 at 137.9125MHz, and NOAA-19 at 137.100MHz with a carrier deviation of ±17kHz. Thus, a receiver of at least 40kHz bandwidth is needed. Also, this transmission uses the right-hand-circular-polarisation (RHCP) at the satellite antenna. Eventually, you shall theoretically require a circularly polarised antenna at the receiving end too. Alternately, if you use a linearly polarised antenna, only half the power is received because only one component, horizontal or vertical, is sensed by the linear antenna.
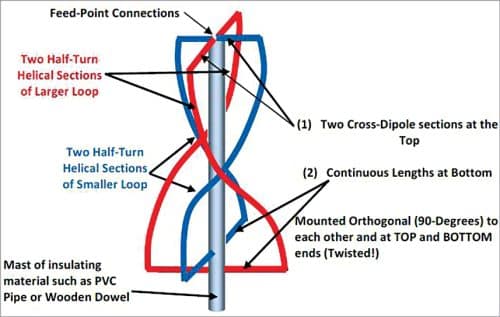
The QFH antenna
Quadrifilar Helix Antenna, or simply QFH antenna, is the right choice for circularly polarised signal. But when it comes to construction of this antenna, it is difficult to find its proper construction details. Further, when you have enough information to start building the antenna, the availability of material locally and at affordable cost is a big problem. If you decide to use the material available in your junk-yard, you cannot be sure about performance of this antenna. So, better to be cautious. The QFH antenna is shown in Fig. 6.
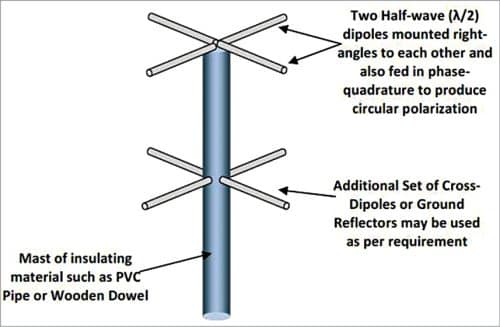
The turnstile antenna
The next alternative is the turnstile antenna. It utilises two linear dipoles placed at 90 degrees or at right angle to each other, with one dipole connected to the necessary 90-degree phasing cable (quadrature connection). This antenna is simpler to construct as it uses only two linear dipoles. However, it has poor near-the-horizon performance, which is required to pick up satellite signals from the horizon or low elevation angles.
The author tried one such combination and found that it offers higher signal gain, hence higher image quality, but only in the ±30 degrees field-of-view (FoV) about the vertical, that is, 120 degrees in total and only when the satellite is overhead and has lesser gain. Almost no image data could be seen near the horizon angles. The turnstile antenna is shown in Fig. 7.
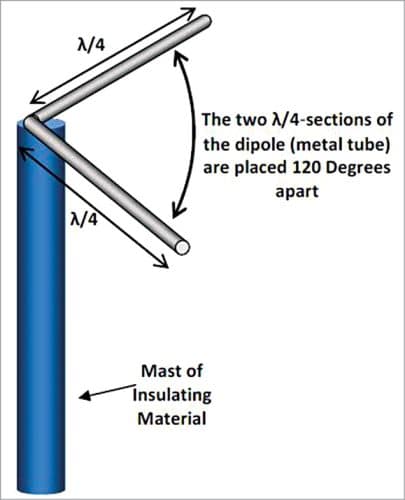
The Vee-dipole antenna
The simplest form of the antenna is the V (or Vee) dipole, which is just an extension of the single linear dipole. In fact, the two quarter-wave sections of a linear dipole are placed or mounted at an angle of 120 degrees as against 180 degrees for the straight linear dipole. You can start with this simple but effective antenna. The author had a linear dipole primarily optimised and tested for the 2m (144MHz) amateur radio band centred at 145MHz.
So, you can begin by constructing this V-dipole. The 137MHz band and the satellite frequencies range from 137.1MHz all the way to 137.9125MHz. Let’s assume 137.5MHz as the central frequency. The free-space wavelength is 2.1818m at this frequency, the half-wavelength is 1.09m, and the quarter-wavelength is 0.54545m.
You shall require a 6mm (approximately ¼-inch) diameter aluminium tube of 1.2m length, which can be obtained from a local hardware shop at very low cost. Cut the tube into two 60cm long identical sections. At one end of each of these sections, drill two 3mm diameter holes as shown in Fig. 9. Leave the 60cm length of these two sections as it is at this stage. We shall adjust the length to optimum value at a later point of time.
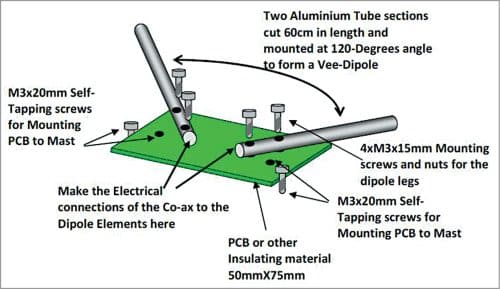
It is strongly recommended to use a general-purpose PCB or any other plastic insulating material or box to mount these dipole elements for better mechanical stability and protection from the weather and dust/moisture. The exact dimensions and construction details are shown in Fig. 9. The author terminated the connections to the dipole elements into a BNC header suitably mounted on the PCB but a panel mount type would also serve the purpose.
Cable connections
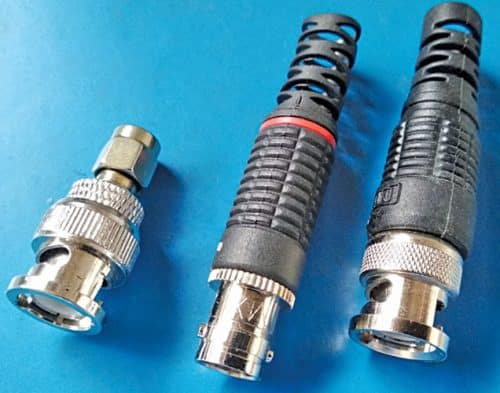
Since this linear dipole offers impedance of about 72 ohms, the commonly available 75-ohm co-ax cable used for satellite television can be used here. You may need about 12 metres of length. You can choose as per your needs but do not exceed 15 metres to avoid significant signal losses due to the cable. Terminate one end of this cable into BNC male plug and the other end into a BNC cable-type socket. Refer Fig. 11 for details. These are easily available in local electronics/CCTV shops. Also, as can be seen in Fig. 9 and Fig. 10, the coax cable is coiled into 3-4 turns near the antenna. This acts as a balun to take care of impedance transformation/matching.
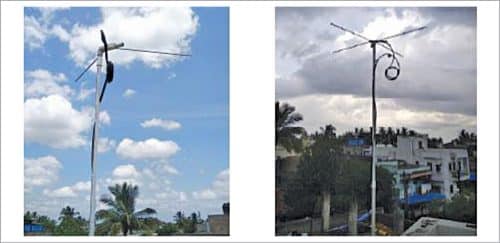
Antenna mount
After your antenna (dipole) assembly is complete, it is time to mount it on the mast. Theoretically and ideally, we need the antenna mounted as high as possible. But there are two limiting factors. First, as stated above, is the cable loss. And the second is the cost of material for the mast and eventually the mechanical stability against winds. The author used just a random length of about 210cm that was available as two surplus 1.27cm dia PVC pipes left over after household plumbing work. See Fig. 9 and Fig. 10 for an idea about the mast. The author had the benefit of a rooftop two stories high.
You are at liberty to choose your own material for the mast as long as it is insulating and stays within your budget. One final word—place this antenna away from power lines and other sources of electrical or RF interference. Any kind of electrical noise or interference affects the image quality—sometimes no data at all!
Low noise amplifier (LNA)
This is the antenna front-end amplifier that raises the signal level by 10 to 20dB. At the beginning stage you need not use an LNA, but it will be useful for receiving the high-quality images from the Russian Meteor M2 satellite. The satellite transmits weather images in the same 137MHz band at 137.100MHz (as received by the author) but not in the analogue APT format. It uses QPSK modulation, with symbol/data rate is at 72kbps, and requires different demodulation approach.
So, for the moment, the LNA is optional. It can however be constructed on your own or bought off-the-shelf. The author built one such LNA, which is under evaluation and testing. A significant cost gets involved with this as microwave/RF components are required to achieve the desired performance.
Receiver
After the antenna, the main part of the receiving station is the receiver. There are affordable wideband software-defined radio (SDR) available as USB dongles. These not only offer reception of the broadcast AM/FM bands but a wide coverage from the LF/MF to frequencies as high as 1.7 to 2GHz, depending upon the device. One commonly used is the RTL-SDR RTL2832-Ver3 USB dongle that can be purchased from e-commerce websites. Alternately, there is RSP1A from SDRPlay, but at a higher price tag.
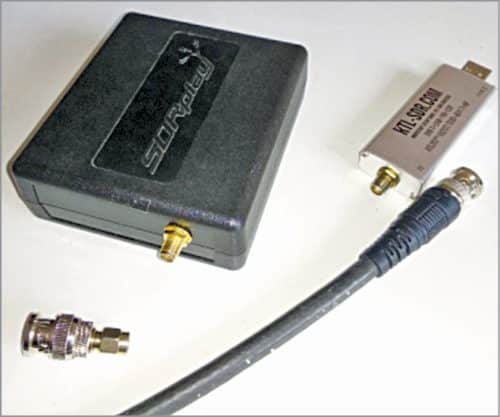
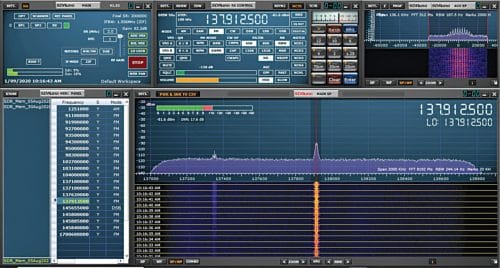
The RTL-SDR dongle uses 8-bit ADC while the RSP1A has a powerful 14-bit ADC. The performance differs, so does the pricing. It differs largely! Therefore, it is up to you to select as per your budget. The author uses both—RSP1A for the NOAA satellites and RTL-SDR for the Meteor-M2. These USB SDRs come with their own user interface, but that only allows you to operate the radio in a conventional manner like tuning to a particular frequency, setting receive mode such as AM, FM, DSB, CW or USB/LSB in case of single side band reception and bandwidth controls, etc. See Fig. 12 for receiver hardware/devices.
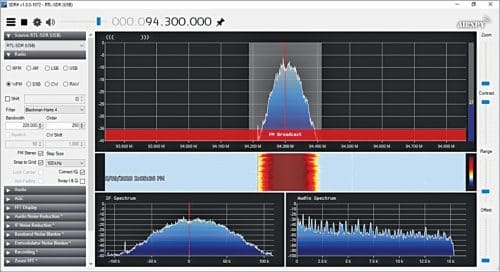
You can explore the software of your choice with the help of the user guide. We shall here focus more on utilising this radio (SDR) to receive the weather satellite signals and use related software tools to decode the images. The screenshots of the GUI-dashboards of these SDR receivers are shown in Fig. 13 and Fig. 14. You can get acquainted with the software by receiving standard broadcasts before proceeding further for the weather satellite reception as there are other set of software (as explained later in the text) required for decoding the images and converting the data into image files.
Software
Besides the SDR software, you shall require a few more, as summarised in Table 2.
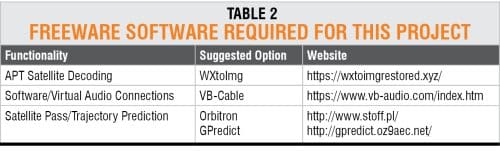
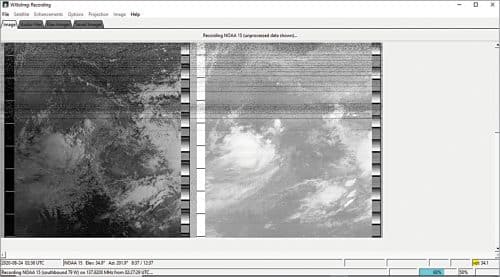
Decoding software. The most popular and easily available as freeware is the WXtoImg software for decoding APT transmissions. This software not only records the audio received from the satellite as a ‘wave’ file (.wav) but also displays the raw image while decoding, and further displays more images after processing the raw data once the satellite pass has been completed. Use the licensed freeware version only, until you are ready to purchase the full-featured licensed version. In the author’s view, the basic freeware is sufficient for an individual experimenter. Refer the screenshot in Fig. 15. Visit the website https://wxtoimgrestored.xyz/ for downloading and details about this software.
Virtual audio cable
A point to keep in mind is that the receiver software (like SDR# or SDRUno) functions separately and demodulates the RF signal and then produces the audio signal from the FM transmission. The decoding software (like WXtoImg) expects the audio signal to be fed for the recording and processing of the audio and convert it into the image.

In older days we used to connect the audio cable (called patch-cord) from the output of the receiver to the input of the recorder. Now, since our receiver is a software-defined radio, and all the demodulation and audio recovery related work take place in the software, we need a ‘soft-cord’ to connect the output of the receiver to the APT decoder software. For this, besides various options, the author used the VB-Cable as a freeware version. Details and software download can be found at https://www.vb-audio.com/index.htm
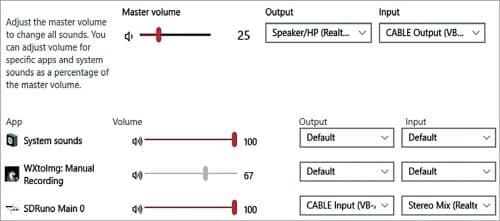
Follow the installation guide for this virtual audio cable very carefully. Once the installation is complete, check in the audio settings of your computer; the virtual cable would be visible and available for setting as shown in Fig. 17. Next, depending on your PC’s sound configuration, select the Audio Out from the receiver to the Input of this cable as shown below:
Receiver Audio OutputVirtual Cable Input
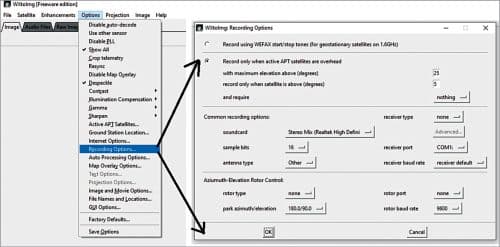
Open the WXtoImg software, locate the Options menu and select the Recording option. Under this locate the Soundcard option and choose the Output from this virtual cable, or as permitted by your PC sound options.
Virtual Cable OutputWXtoImg OptionsRecordingCommon Recording
(EFY Lab note. During testing, the virtual cable option was not successful in Windows 10 but worked well with Windows 8.1. It is working well with default sound settings in Windows 10. You should check the sound device and settings in your PC in case it does not work.)
To test whether your audio connections are proper, follow the steps given below:
Step 1. Start your receiver software and tune to the FM stations. Keep volume level low (15 to 20) from your computer sound control.
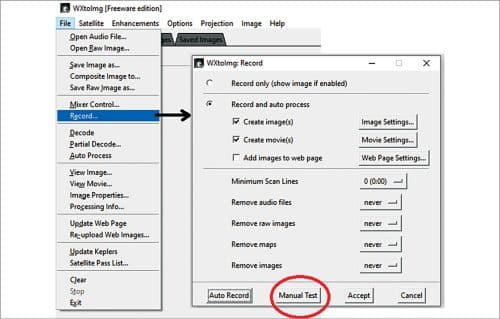
Step 2. Start the WXtoImg software and under main File menu, choose Record submenu. The recording dialogue box appears. This is where you need to start capturing the weather images from the satellite. Under this, click on Manual Test button as shown in Fig. 19.
Step 3. If the audio is not connected from the receiver to the decoding software, you shall see a plain black picture window as shown in Fig. 20. This indicates that the audio is not connected to the decoder software, so you should re-check and configure the computer audio properly. Choose the File menu, then the Mixer Control submenu, and select proper settings for the audio connections and proceed to next step.

Step 4. When audio settings are proper, the WXImg software would start displaying RAW Image. If your audio is connected properly, you shall see a grey-scale image pattern as shown in Fig. 21. This indicates that your audio connections are alright. Otherwise, you need to go back to the audio settings once again.
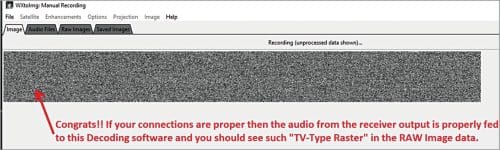
Step 5. If step 4 is successful, go to the receiver software and tune to a dead spot on the FM band where no station is received. Then return to the WXtoImg decoder software window. You should see a TV-raster like image due to the hissing sound from the FM radio without any kind of audio (see Fig. 21).
If you are successful in steps 4 and 5, then all your software configurations are working fine and you can now receive the actual signal from a satellite.
Satellite prediction software. Now that you are ready with the antenna installation, receiver, and the decoder software, it is time to find out when the satellite will come near your location. For this, you can either use an online tool to find the passing satellites, or you can download and install offline tools to predict the satellite trajectory. The author tried two options—Orbitron and GPREDICT. Both these are available as freeware and can be found at http://www.stoff.pl/ or http://gpredict.oz9aec.net/, respectively. You can use any one of these. The author uses GPredict as shown in Fig. 22.
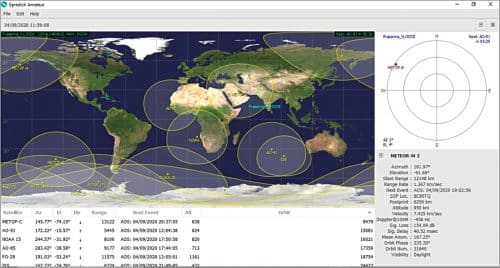
Alternately, the WXtoImg software also produces a satellite pass list from the main File menu. You can use any of the above two tools to complement each other. It is suggested to save the satellite passes into a text file for future reference.
Analogue APT image reception
Now, you are ready to receive the actual satellite signals. Start your receiver at least five minutes before the arrival of the satellite on the horizon and tune to the satellite frequency. Keep the receiver bandwidth to a minimum of 50kHz. Wideband FM settings of 150kHz or more would simply add more noise to the signal.
Open the prediction software to look for satellite and its position on the map. With practice you should be able to learn well when your receiver starts picking up the signal.
Open the WXtoImg software and under the main File menu choose the submenu Record and then Auto Record option as shown in Fig. 23.
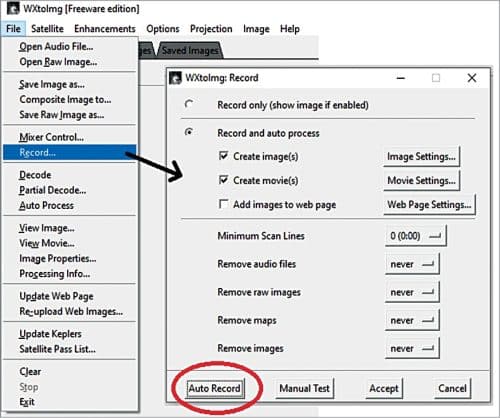
If the satellite is yet to arrive on the horizon in your sky, the recorder in decoding software will wait and display the status accordingly. Once, the satellite appears, the software starts decoding the image from the received audio. You can watch the raw image as displayed by this software during the transit of a satellite as shown in Fig. 15.
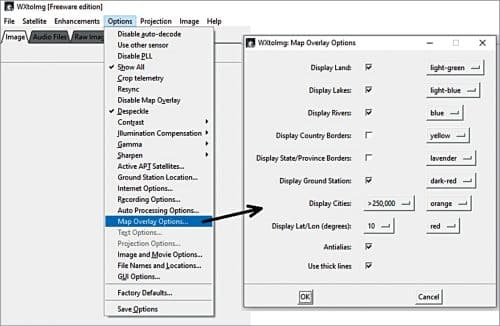
Once the satellite pass is completed, the software automatically processes the raw image and then displays and stores the processed images. To display the raw images, the map overlays, and other features on the processed data, go to the main menu Options and choose Map Overlay Options submenu and follow the steps in the dialogue box as shown in Fig. 24.
A couple of processed images, after the signal has been received successfully from a satellite transit, are shown in Fig. 25 and Fig. 26.
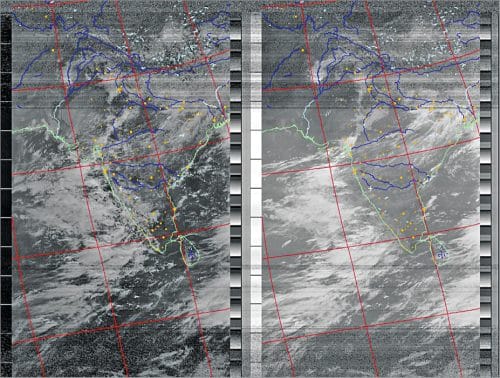
There might be many features disabled in the freeware version, but you can experiment and try various image enhancement options. But the images obtained are beyond doubt sufficient for an experimenter to see the clouds and carry out basic scientific studies. The author is thankful to the original authors/creators for their excellent work in making the freeware software available for the experimenters. The copyrights, where applicable, are honoured with thanks.
With the above steps-by-step information, the author is confident that this article would help and guide the readers in setting up their own weather satellite receiving station. Kindly note, this experimentation requires great patience and consistency in efforts to establish and maintain your weather satellite receiving station. Once you start receiving the images on a regular basis, you can identify the areas to improve and work towards achieving better and better results.
Prasanna Waichal holds a master’s degree in electronics and has more than 25 years of work experience in industrial R&D for design and development of specialised and strategic electronics systems and academic teaching and research at post-graduate levels, both in India and abroad. His passions include radio reception and studying solar activities and their effect on ionosphere on earth. He is also a licensed amateur radio operator with call-sign VU3OOI. He claims to have discovered a method to predict earthquakes using very-low-frequency (VLF) multi-path-multi-frequency propagation technique.