


Customise, automate and interpolate the powerful software to increase it’s capabilities for signal processing and measurement precision
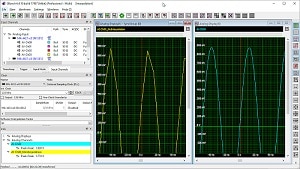 A number of new functions have been added to SBench 6-Professional, the software that is used for controlling Spectrum Instrumentation’s 130 different high-performance digitizers, 55 different Arbitrary Waveform Generators and 5 Digital I/O products. SBench 6 provides an easy-to-use graphical interface for instrumentation control as well as data acquisition, generation, display, analysis and documentation. The new features expand the versatility of the software by adding functionality for automation as well as increasing the software’s capabilities for signal processing and measurement precision.

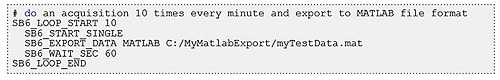
Scripting allows easy automation
For users who want a simple way to utilise SBench6 in an automated sequence of operations, a scripting tool is now available. Scripting allows basic commands to be arranged via a plain ASCII file that is called by the SBench 6 program. For example, SBench 6 can be instructed to load specific configurations, start and stop acquisitions, wait or loop, export data and even call external programs.
Improve the accuracy of measurements with data interpolation
Another useful addition to the SBench 6-Professional software is data interpolation. This powerful feature can be used to dramatically improve parameter measurements in situations where the sampling rate of a digitizer is limiting measurement precision. Based on the SinX/x (or sometimes called SinX) algorithm, the SBench 6 interpolation function inserts samples in a predictive manner between the actual acquired data points. When done correctly, this produces a waveform with a higher effective sampling rate and a closer approximation to the analogue waveform that is being analysed.
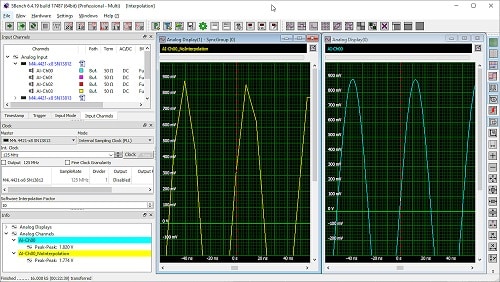
The benefit of interpolation becomes apparent as the input signal frequency begins to approach the Nyquist limit (half the sampling rate). Consider figure 2. Here a 20 MHz sine wave with 1.82 V amplitude is acquired by a digitizer sampling at 125 MS/s and with 16-bit resolution. The yellow trace on the left shows the signal without interpolation and with the sample points connected by linear lines. The blue trace on the right is the same signal but with interpolation activated. Both traces have been expanded vertically so you can examine the top of the sine wave.
Note that the 20 MHz signal is still well below the Nyquist limit of 62.5 MHz. However, the yellow trace (without interpolation) already has an insufficient sampling rate to precisely measure the signal’s amplitude. The problem is that, at 125 MS/s, each cycle of the sine wave only contains around six sample points. Activating the interpolation function effectively improves the sampling rate. In this example, an interpolation factor of 10 was selected, creating a trace with 60 samples per cycle. Parameter measurements for the Peak-to-Peak amplitude (lower left corner) made for both traces show the significant improvement in amplitude accuracy that is possible.
Providing the frequency content of the input signal does not exceed the Nyquist limit, interpolation can be also be used to improve other parameter measurements (such as rise and fall times, as well as cyclic measurements like frequency and period).
Perform Customised Calculations
SBench 6-Professional has an extensive array of data processing tools (e.g. FFT analysis, math functions, filtering, averaging, parameter measurements, etc.) that can now be complemented by a new plug-in option which enables users to create their own customized calculations as a self-compiled plug-in that is automatically linked into the SBench 6 calculation pool. The plug-in option includes an SDK as well as several examples based on the C++ programming language. It allows programmers to develop their own plug-ins by combining advanced calculations on the acquired signals. Any calculation that can be realised with standard development methods is possible. Furthermore, any files in the system (such as filter parameters, sensor calibration values or reference signals) can be utilized in the calculation. The SDK also provides a call-back function for interaction with the user so that simple dialogues and other information, such as cautions or critical warnings, can then be flagged to the user.
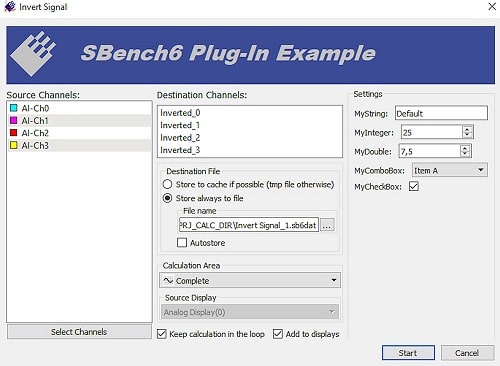
The plug-in option allows users to integrate their own processing functions directly into the SBench 6 program. Resulting signals can be displayed, used for further calculations, exported or can be part of a report. For example, when using a digitizer together with sensors, the plug-in could embed specific sensor calibration information into the program. Figure 3 shows a typical plug-in example where signals are inverted and stored. Note that programmer can define the calculation configuration using integer or double values, combo boxes, strings or checkboxes. Programming custom calculation routines can turn SBench 6 software into a powerful application-specific tool. Once the routines are developed, the resulting plug-in files can be freely distributed with any SBench 6 Professional license to end-users.
Calculate Single Values
As part of the SBench 6 enhanced measurement capabilities, it is now also possible for the new Formula function to calculate single values. These values can be computed from the cursor information, any sample of a source signal or even from other calculation results.
Adding to the processing flexibility, “single values” can even be accessed and incorporated into a formula when creating new waveforms with the program’s Function Generator feature. The result is a waveform creation tool that lets you make waveforms using recorded or loaded signals, an extensive list of mathematical operations and single values!
Detect out-of-range signals with Input Channel Preview
To make setting-up the input ranges of a digitizer fast and easy, an Input Channel Preview window has been added to SBench 6-Professional. The window works by continuously monitoring the input signals at a low sampling rate and then displaying their key signal characteristics using a bar graph. The Input Channel Preview window reveals, for each active channel, the signal’s current minimum, maximum and average value. Colour coding (green, red and yellow) then highlights when signals are in and out of range or when an input range has changed status. Users are instantly alerted to each channel’s condition, making it immediately obvious when changes to the setting of their gain or offset may be required.
Free for all SBench6-Professional Users
With the exception of the Plug-in tool for customised calculations, which is an option, customers already using SBench 6-Professional can access the new capabilities (Scripting, Single Value Formula, Input Channel Preview and Interpolation) for free.
The functions, along with other recent additions to the program, such as FFT based Power Spectrum Density measurements, can be obtained simply by downloading the latest version of the software directly from the Spectrum Instrumentation website.
A free trial version of SBench 6-Professional is also available for anyone wishing to test the program’s capabilities. The program runs with simulated hardware to allow users to get a full understanding of how it operates.