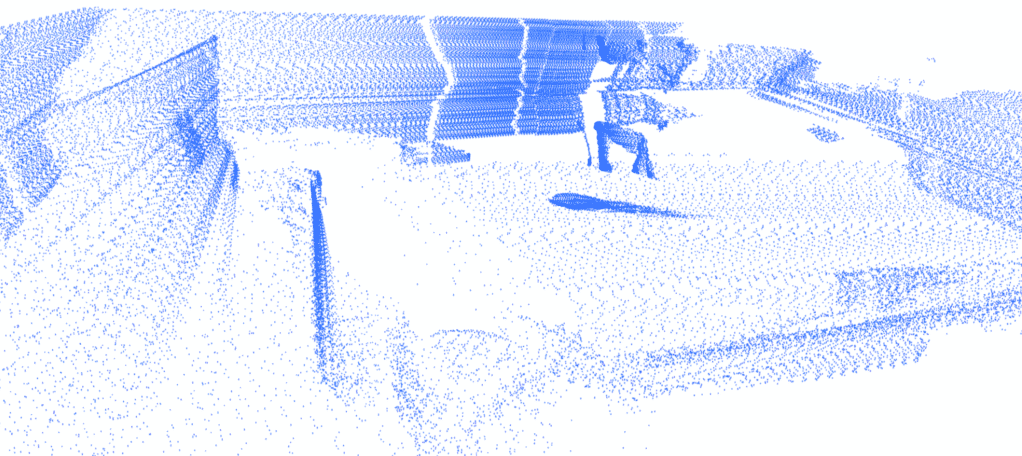





This is a DIY electronics project article that teaches how to build a low-cost 3D LiDAR mapping system using a standard 2D LiDAR sensor, Python, and affordable hardware such as a Raspberry Pi or laptop. Unlike commercial 3D LiDARs that cost hundreds or thousands of dollars, the project demonstrates how a 2D 360° LiDAR can be converted into a functional 3D scanner by moving it vertically (Z-axis) while collecting scan data.
A 3D lidar mapping system can be understood as building a scene layer by layer, in which a 360-degree scan captures a horizontal slice of the environment, similar to drawing a single floor plan. As the sensor moves upward, additional slices are captured at different heights. When these layers are combined, they form a complete 3D view of the surroundings.
Based on the principle, 3D lidar mapping is widely used across robotics, in map creation, surveys, ADAS, and even construction sites, making it one of the most important mapping technologies in use today.
For 3D point cloud lidar mapping, multi-point cloud 3D lidars are often used. These systems generate a large set of 3D points, often called a point cloud, that represents the surfaces of objects in the environment. This allows accurate reconstruction of the surrounding scene, but such Lidar systems can be expensive.
Another approach is 2D lidar mapping, where 360-degree lidar scans a single horizontal plane and measures distances to surrounding objects. The collected data is processed using SLAM (Simultaneous Localization and Mapping) software such as Hector SLAM to generate a two dimensional map of the environment. This method can be cost effective and is widely used for navigation and localisation, but it does not capture height information and therefore cannot produce a complete 3D representation.
This design adopts a low cost approach to 3D lidar scanning and map creation by converting a 360-degree 2D lidar into a 3d mapping system using dedicated hardware and software.
The initial design uses a low-cost lidar, YDLidarX2. However, the code can be modified using other lidars as well, such as the RPi lidar or lidars from other manufacturers. The idea is to combine hardware and software. The lidar data is converted into 3D scans by moving the lidar in 360 and Z-axes.
Once the code runs, it starts generating the scan data. A stepper motor can be used to move the lidar slowly towards the Z-axis in an upward direction, or it can be done manually by moving your hand gradually towards the upward direction of the 360-degree point scan data. As the lidar is moved, the scan data is added based on the rotation and movement towards the Z-axis in the upward direction to stop the scan.
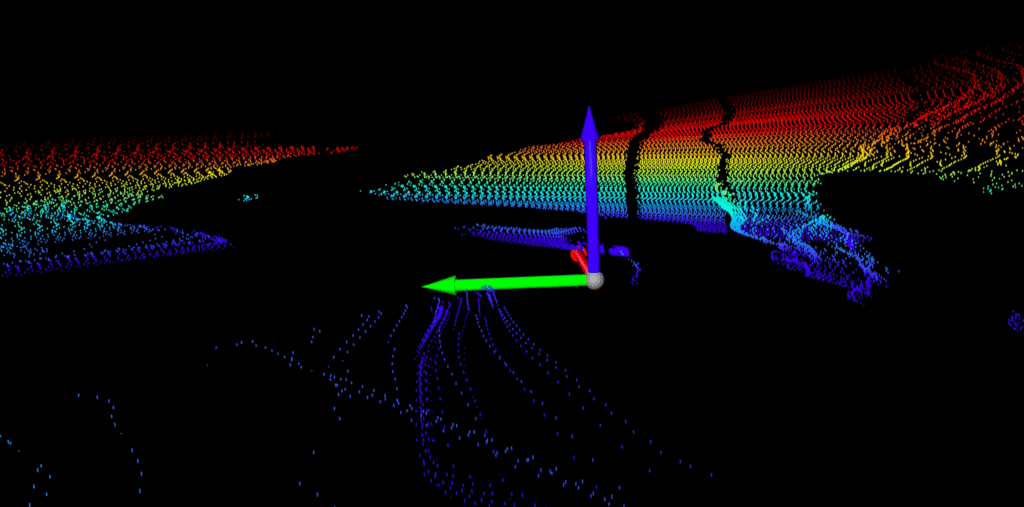
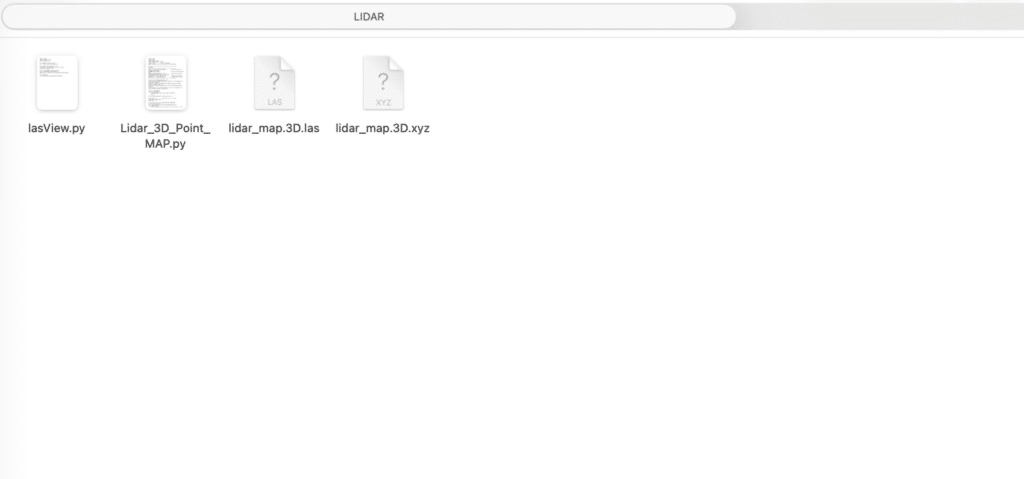
Once the scan is complete, the data is displayed in real time as a 3D point cloud. After the scan is finished, it generates map files in .las and .xyz formats. These files can be viewed in any online or offline SLAM or lidar map viewing software, or can be read and displayed using other software we created to view the generated map.
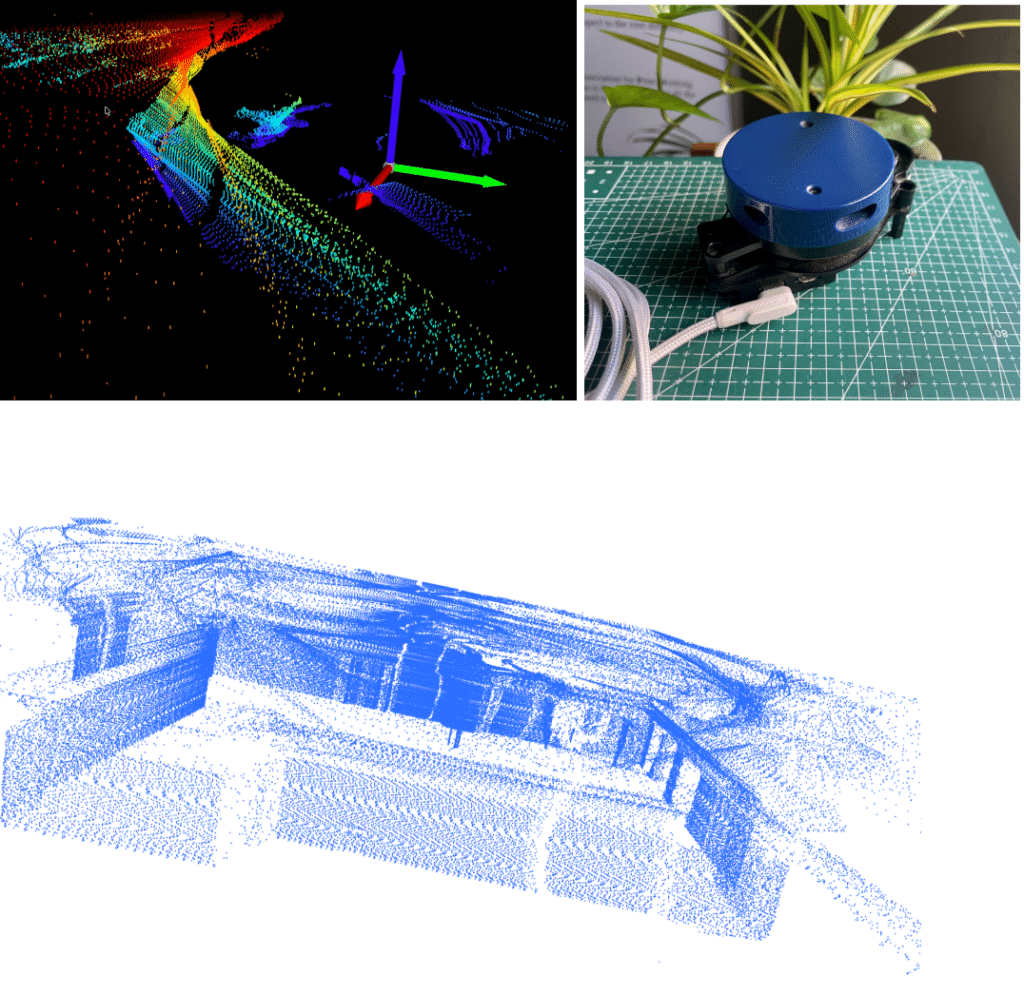
Bill of Materials
Here’s how to use the Raspberry Pi 4 or Nvidia Jetson for wireless data processing, or a laptop with Python installed for the same purpose. Currently, a MacBook with macOS is used for this task, but the installation and code execution will be the same regardless of the device used—whether it’s a Raspberry Pi, Nvidia Jetson, ROS-based Linux device, or a laptop.
| ID | Name | Description | Quantity |
| 1 | Lidar | YDLidarX2 8M range | 1 |
| 2 | YD Lidar Driver Module | USART to USB-C Module | 1 |
| 3 | USB C Cable | USB C Cable | 1 |
| 5 | SBC | Raspberry Pi 4/ Nvidia Jetson | 1 |
Code for 3D Lidar Mapping
To begin with the code setup, first, the installation of Python is required on the system, along with its Integrated Development Environment (IDE). Any Python IDE can be preferred; here, Thonny Python IDE is used. On devices like Raspberry Pi, macOS, Nvidia Jetson, and many Ubuntu- or ROS-based operating systems or single-board computers, Python is usually pre-installed. Therefore, the step can be skipped if it’s already installed.
The next step is to open the Linux terminal and install a few libraries and the Software Development Kit (SDK). Here, the YD lidar is used for 3D scanning, downloading and installing the YD lidar SDK based on a specific lidar version.
If a different 360-degree lidar is used, download the SDK from the manufacturer’s website, as each one comes with its own SDK and Python library. The SDK file is attached for the lidar, and the lidar code can be downloaded.
After that, we need to install the other Python libraries required for processing lidar data, creating maps, and saving the maps from lidar data. For numerical data processing, we need to install the NumPy library. For the map creation, use the laspy library, and for generating 3D data of the map and displaying it, use the Open3D Python module. Install the libraries one by one and open the Linux terminal to run the following commands:
sudo pip3 install numpy
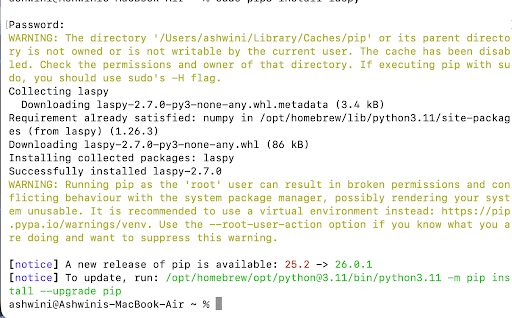
sudo pip3 install laspy
sudo pip3 install open3d
Now, two separate codes can be created: One for the scanner and mapping code, and the other for the map viewer code. The scanner and mapping code will scan the environment using lidar and generate a 3D map from the collected data. This develops the map viewer code that will display the created 3D map.
First code: 3D mapping/scanning code
This code will scan the environment using the Lidar, collect point cloud data, create a 3D map, and save it as both a .las file and a .xyz file.
Second code (Optional): Simple map viewer code
This code will load and display the created 3D map. The code writing can be skipped, and any free .las viewer software (such as CloudCompare, LAStools, or online LiDAR viewers) can be used to open and view the saved .las or .xyz files.
3D mapping code
For the 3D mapping code, the first step is to import the important libraries and Python modules that assist in processing the lidar data and creating the map. Import the lidar SDK that comes with the specific lidar model. Here, YDLidar X2 is used; therefore, to import the appropriate SDK, download and install the YDLidar-SDK from the official GitHub repository and build the Python bindings.
The next step is to set the path where the created map files (both .las and .xyz formats) can be saved. In case only the file name is provided without a full path, the code will save the files in the same folder where your Python script is located.
Finally, to configure the serial port name of the lidar. Find the correct serial port after connecting the lidar to the device. Open the Linux terminal and run the following command before connecting the lidar:
ls /dev/tty*
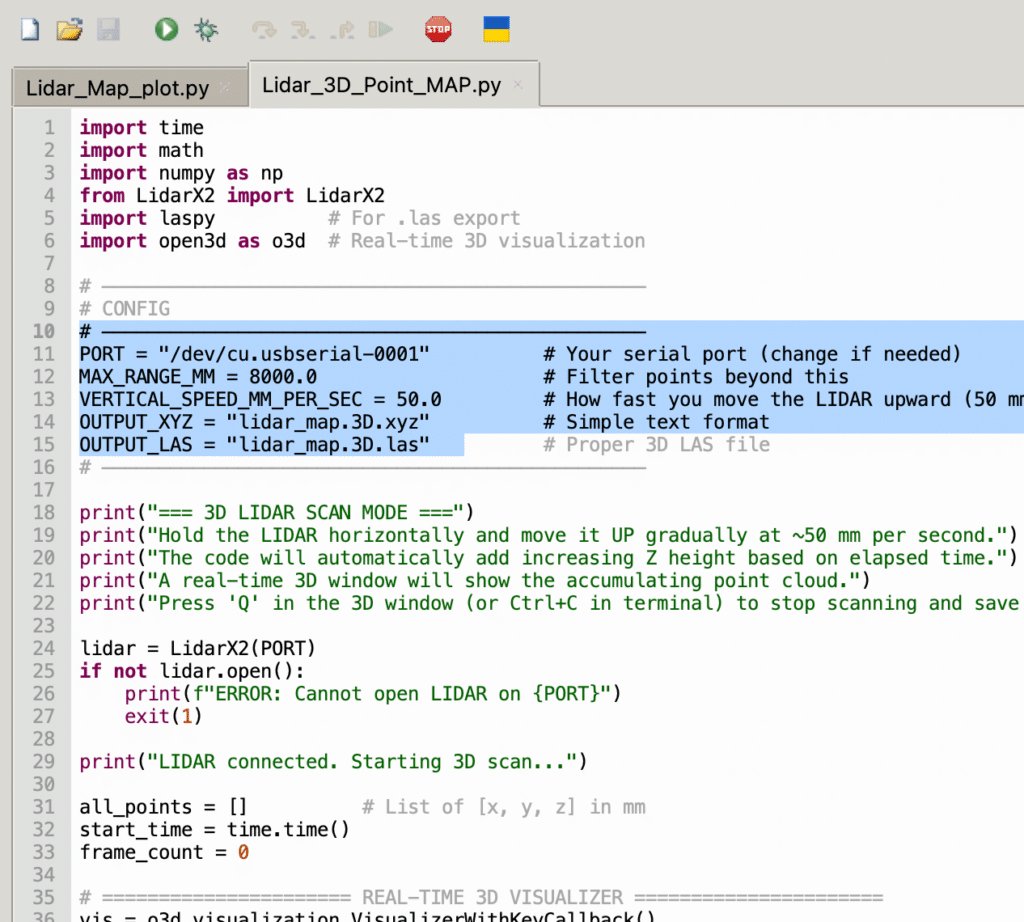
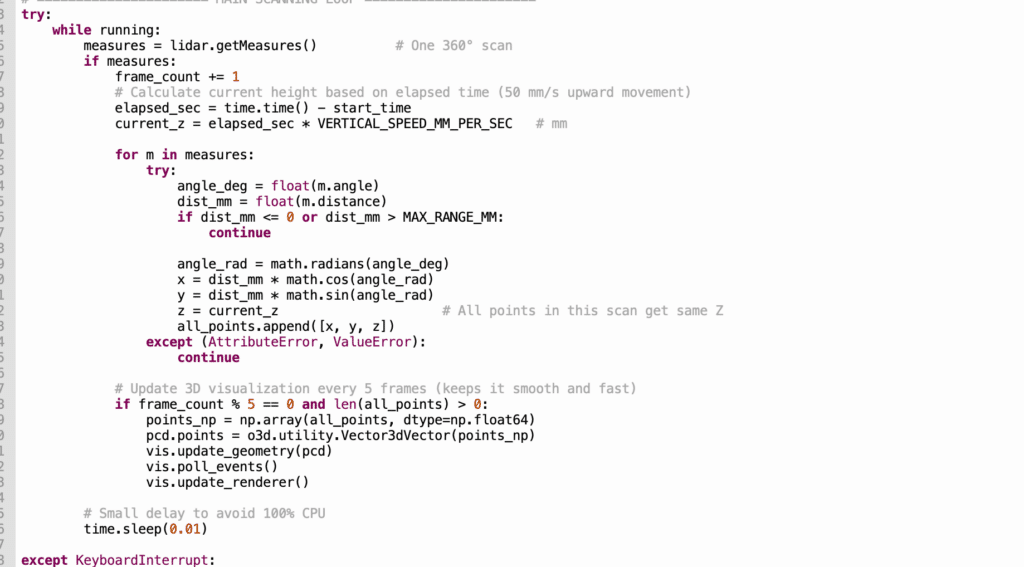
Next, create the while loop in code which reads the lidar data, stores it in a numpy array, and then uses the las python module to create the 3D map data by adding each layer in the Z-axis from the 2D scanned data of the lidar to create the map and also display it in real-time using open3D.
After scanning, press Q to stop and save the map created in .las and .xyz files. (Refer to Fig 4 and Fig 5)
Map viewer code
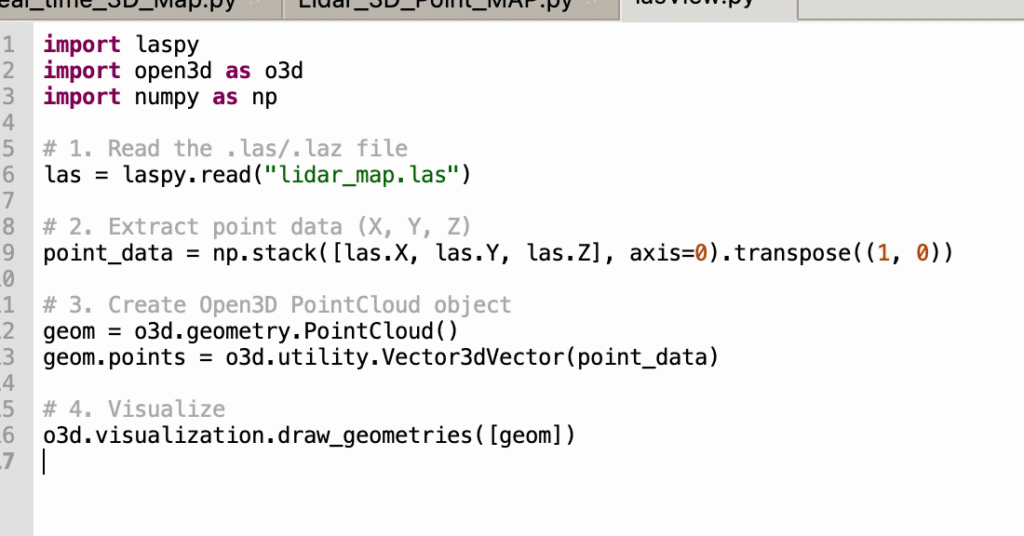
The next step is to create the map viewer code that opens the .las file and uses Open3D to display the .las map file in 3D. The code is quite small and simple. First, import laspy and Open3D Python libraries and numpy to process the data. Then, configure the file name and path in the code where the .las map is saved in the map-creating code. Finally, use Open3D to display the map in 3D after processing the .las file using lasPy.
Testing 3D LiDAR Mapping
Now, for testing, plug the lidar into a USB in your SBC, such as a Raspberry Pi, Nvidia Jetson, or the system used. Then, open the IDE and configure the T PORT name in the code. Run the Python code from the IDE, and it will start scanning and creating the map.
If the hardware is preset to move the lidar a few millimetres every 30 to 40 seconds up or down in the Z-axis, then the lidar can be mounted onto the system. Alternatively, the hardware can be manually moved by lifting your hand gradually and holding the button of the lidar every 40 seconds. The real-time output of the lidar scan data and map updates can be seen in the 3D window opened by the Python code after running the code.
Now, after completing the scan, the simulation can be stopped by pressing the “Q” button. It will save the lidar file (.las) and .xyz in the path where you set it earlier in the code. If only the file name is provided, it will create and save the map file in the same path where the code is saved.
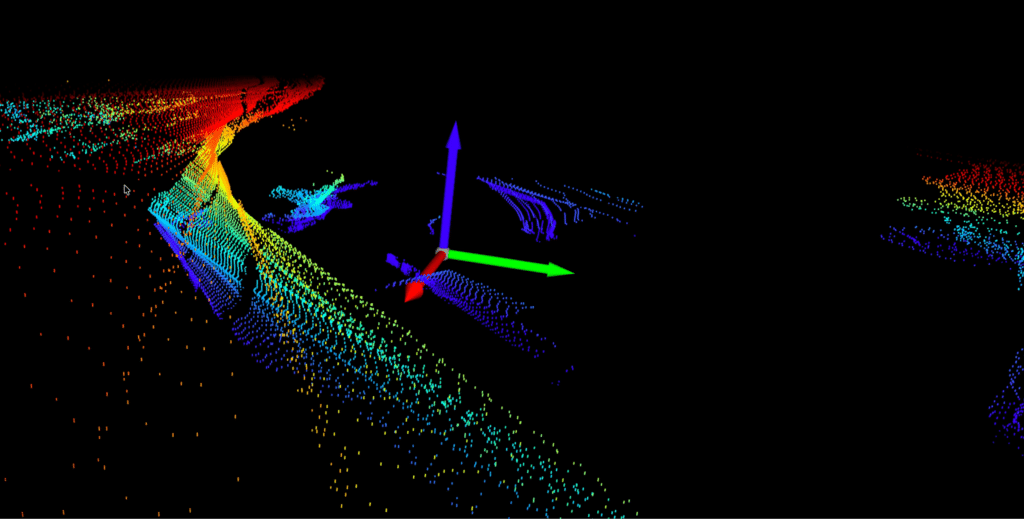
Now, open the Lidar viewer code and configure the path of the .las file saved earlier. Then, run the code. It will display the point cloud map of the lidar scan created earlier in 3D, which can be further processed or used in robotics, ADAS, as well as in other mapping-based designs.