


With electronic signals becoming a way of life, it is important for researchers to process and then analyse these effectively. The signal could simply be a spectrum from MATLAB or the graph of a song.
The software we are going to cover in this article is an application for viewing, analysing and annotating the contents of audio files. In other words, this is a piece of software developed to aid you with signal processing. The fact that this tool is licensed under GNU general-public licence and runs on Linux, OSX and Windows, makes it easily adaptable. Take a look at when you have time. For now, let us learn how to use this software to understand electronic signals.
Analysing data in the message
The simplest way to study a signal is to see the information it contains at different time instants. A traditional waveform-peak display of the input audio signal is simply a plot of amplitude versus time, highlighting the peak and mean values. From amplitude, we can derive information about aspects like power and signal propagation, thereby analysing its waveform, which is the simplest way to learn from a signal.
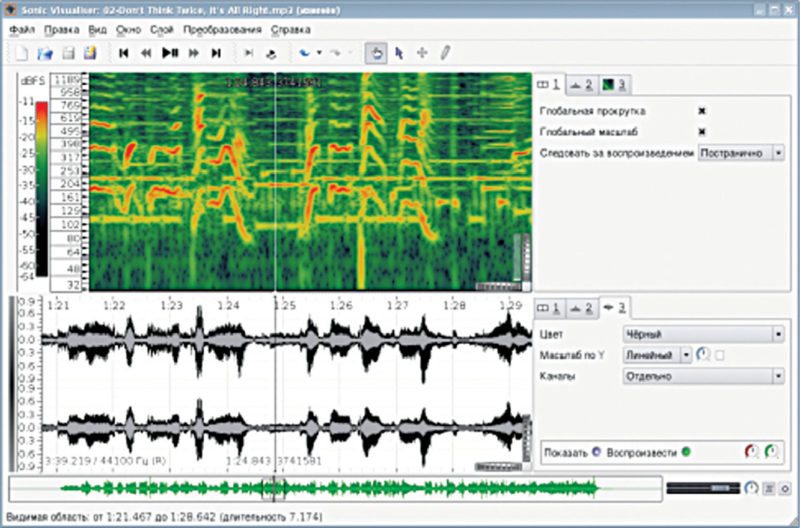
This tool allows us to view amplitude in linear, decibel or a non-linear metered mode, which is intended to make peaks more apparent than dB scale, but quiet sections easier to see than linear scale. We can also control gain of the display and normalise the visible area so as to ensure full-scale displacement for the largest value in the visible section of the waveform.
A waveform may also have different channels and we can choose to have these as individual ones, or one channel that is a summation of all. For stereo audio, enabling butterfly mode shows positive peaks corresponding to one channel and negative peaks for the other.

Dissecting the signal to find underlying frequencies
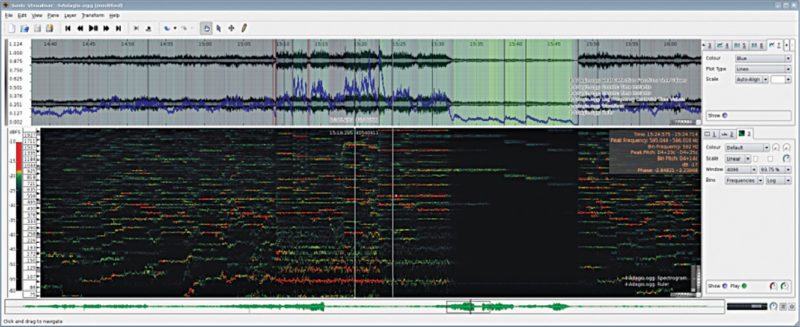
Most times, real-world signals are a combination of many frequencies. Using Sonic Visualiser, you can visualise the signal as a spectrum layer or a spectrogram layer. The spectrum is a plot of intensity versus frequency at a given point in time. The scale animates as audio is played, making the experience smooth. As the wave progresses, various frequencies can be connected by lines, steps or blocks.
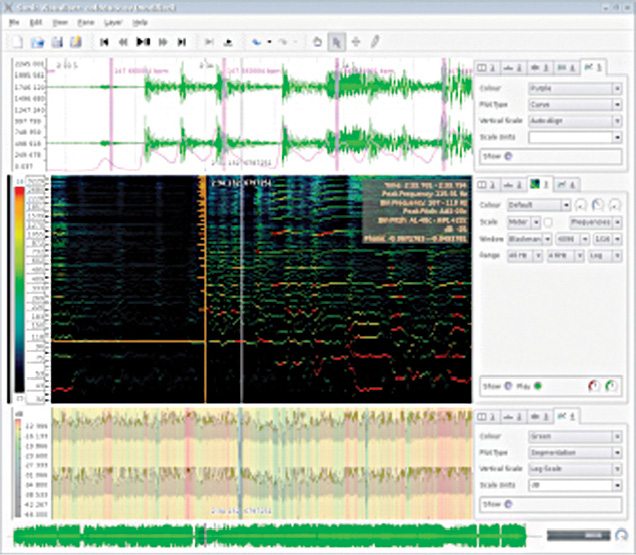
A spectrum can be considered a vertical slice of a spectrogram (a spectrogram describes the change in frequency over time). Brightness or colour of pixels indicates the phase changes. An online course explains a spectrogram thus, “Speech is a continuous flow: phones are not discrete or distinct from each other, but these merge into one another, and spectrograms assess and visualise this continuity.”
 Both of these visualisations allow us to change the scale and range of the signal in display. We can even observe waveforms in different colours according to frequency. A very useful colour-rotation feature for sudden transitions helps isolate areas with similar signal levels. To obtain the spectrum or spectrogram, a series of Fourier transforms have to be applied to the signals. We can set window size for a frequency-time balance, fix window overlap to decide the proportion of overlap and select window shape from a list of Hamming, Hann (also known as Hanning), Blackman, Blackman-Harris and Nuttall (cosine based windows), Gaussian, Parzen, triangular and un-windowed (rectangular) options. Hann window is the default and should be appropriate for most purposes.
A few layers for handy viewing
For perfect time analysis of the signal, we can add vertical lines corresponding to a given time instant, label instants, display points differently, connect these via lines/curves or even segment regions. A note layer that helps group points as notes, a region layer to apply a particular operation on just a section of the signal and a text-and-image layer are also present.
Often, harmonic notes lead to confusion in audio analysis, and to help with this, this tool offers a harmonic scale to pinpoint respective signal frequencies. There is also a colour 3D-plot option for signals that have groups of frequencies at different time instants, with each group having its own value. The plot is not editable and appears only when a transform whose output is appropriate for grid display is applied, or when importing certain types of annotation data. For an instantaneous display of y-axis values of a 3D plot, we can invoke a slice layer. As Sonic Visualiser website puts it, “a slice is to a colour 3D plot as a spectrum is to a spectrogram.”
Plugins to generate new layers and create effects
Third-party plugins can be used with Sonic Visualiser to enhance understanding of the input signal. The general format for audio-analysis and feature-extraction plugins is Vamp, which takes in audio input and generates output compatible with display of Sonic Visualiser layers. We could also have plugins in Linux Audio Developer’s Simple Plugin API (LADSPA) or Disposable Soft Synth Interface (DSSI) formats to create effects like compression or to generate data using controlling parameters like sine-wave tone or white and pink noise.
Other simple, yet indispensable features
A measure tool helps us select the exact range of the signal we want to work with, or maybe observe repeatedly to detect something amiss. A friendly and appealing user interface lets us customise everything from default frequency to background colour.
Sonic Visualiser is structured around panes and layers. Panes are horizontally-scrollable areas that can be stacked one above the other, and a pane can have any number of layers in it. Easy export and import of audio files using export layer and handy annotation add to the glitz.
A mini iPod for signal processing
Processing a signal requires revisiting segments repeatedly, making changes to portions and studying results closely. Sonic Visualiser comes to our aid by offering a hassle-free playback-and-pause platform. Much like a media player, we can use keyboard shortcuts to control the signal being viewed. It is also easy to align different waveforms along the same time scale and instant. This comes in very handy while comparing signals to find differences between similar-looking ones or when viewing multiple files concurrently. We can even time-stretch playback, slowing it down to as little as ten per cent of the original speed, while retaining a synchronised display.
Version 2.5 released in October 2015 works on Pentium4 and AMD64 processors. Developed at Centre for Digital Music, Queen Mary, University of London, and partially funded by many organisations. Let us begin our experiments with audio signals.
Download latest version of the software
Priya Ravindran is a technical journalist at EFY
