


 Handheld devices play an essential role in the healthcare industry. With the sensors becoming smaller and compact, making a handheld device is also becoming easier and affordable. Heart rate measurement systems, or HR machines, are now available almost everywhere, as a feature in smartwatches to full-size stand-alone machines. Here is a simple handheld measurement system that can display a persons’s heart rate on an OLED display.

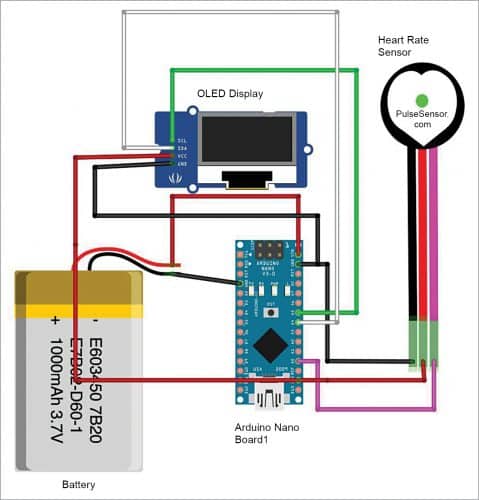
Heart rate sensor
It is used to capture the heart rate from a person’s finger-tip and send as an analogue value to the microcontroller in Arduino board. The value, which ranges from 0 to 1024, is read on the Arduino’s 10-bit analogue-to-digital (ADC) module. The value is then mapped to display the heart rate on OLED display.
Arduino Nano
Since the project aims to be cost-effective and efficient, Arduino Nano is a perfect controller for such an application. We want to have the freedom of having analogue pins and also a small form factor. The Arduino Nano also features an on-board I2C data bus line, which makes the use of any I2C device possible and accessible over the controller.
This controller has lower voltage requirements as well, making it perfect for battery based applications.
OLED display
It is a small 2.44cm (0.96-inch) OLED display with 128 x 64 pixel resolution. The major reason of using an OLED display over conventional display is to have full control over the pixels and to display the data as a graph.
Scanning for I2C devices
The display can be configured by first understanding the communication protocol that works on I2C protocol. This protocol can be used in multiple applications. First write and test a scanner code (i2c_scanner.ino) to find the display connected to Arduino board. The code is simple and can be explained in following two major sections:
The setup section
The setup section sets up the serial connection with the Arduino and allows to receive the data back at the baud rate of 9600. The baud rate decides the rate at which the data will be transferring from Arduino to the laptop/workstation.
The loop section
The loop section is the part where the major scanning takes place. It is used to scan devices by the for ( ) loop. The loop sends data to multiple addresses and then waits for data to be received back in the controller. The code then displays the exact address on the serial monitor window. This device scanner code can scan for multiple devices and display all of them. Scan result for this device would show the address as 0x3C. This confirms that OLED display is connected to the Arduino board.
Software
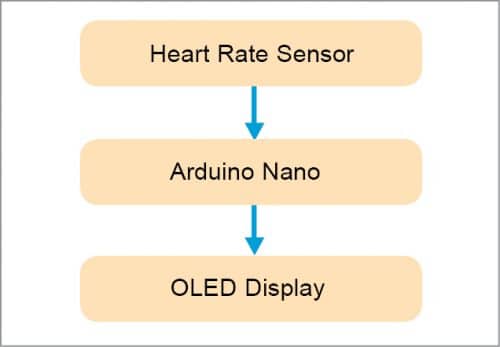
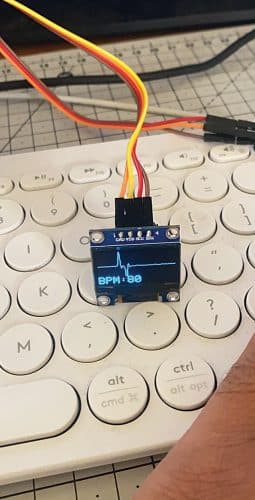
The code’s functioning is described by the simple block diagram shown in Fig. 2. The OLED display will show both numerical and graph as shown in Fig. 3.
The code starts with import Adafruit library for display SSD1306 into Arduino IDE. We further define the OLED display and set the address as 0x3C in the main code (heart_rate_monitor.ino). The OLED resolution is then set to 128 x 64. The display is configured in the next part with all the standard variables.
The setup section of the code allows the display to be captured and configured with the address of the display. After configuration, you need to clear the display for any garbage pixels and clean it for displaying the text.
After this, we move to the main loop, which is responsible for setting up the process and capturing the values through analogue pin of Arduino. The analogue pin A0 of Arduino is used for connecting to heart rate sensor. The sensor data is then stored in a variable named as ‘value.’ This variable is mapped in later part in the code to display the sensor values in terms of the heart rate.
Following simple mathematical formula is used for displaying the heart rate:
BPM=int(60/(float(BPM)/1000))
It basically converts the pulses into beats per minute (BPM), which allows the final BPM to be figured out. Here ‘int’ is integral value of the equation needed. This is done to remove any kind of decimal points, if generated.
Next, the program plots everything on a line graph with the help of Write command, which creates points that end up making a line graph. Finally, the program displays the numerical BPM value at the end of the display screen as well.
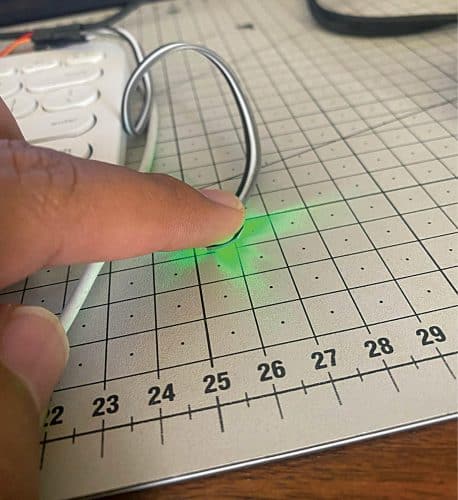
A finger is placed on the heart rate sensor to measure heart rate as shown in Fig. 4.
Download Source Code
Aman Malhotra is co-founder & CEO, Proxie Studio, India

I like Electronic For You, it contains Beautiful articles which can as Real-time Projects only problem is the right Electronic spares.
Thank you for your valuable feedback.