

Sensors now play a pivotal role in how environmental changes are perceived, monitored, and addressed. These smart devices capture real-world inputs—temperature, humidity, pressure, moisture—and generate the raw data that powers innovation across agriculture, healthcare, environmental science, and smart infrastructure. Their value lies not just in data collection but in effective visualisation and application.
Consider a remote agricultural field where soil moisture is tracked continuously, anomalies are detected in real time, and decisions are made from afar. Integrating sensors with web technologies transforms this into a practical solution. This fusion bridges hardware and software, enabling real-time visualisation, trend analysis, and seamless offline data logging.
POC Video Tutorial:
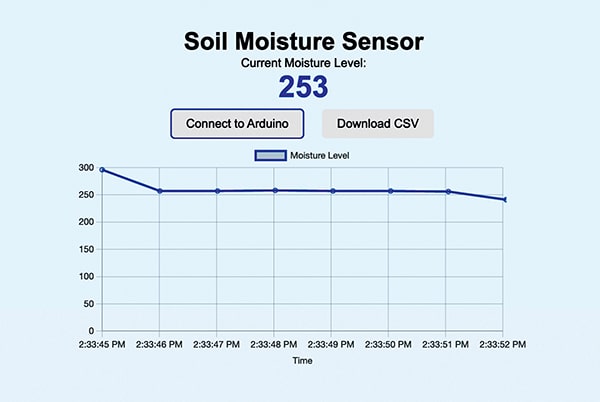
Built using a soil moisture sensor and an Arduino board, this system sends data to a web page via the browser’s serial API. A dynamic line graph offers real-time updates, with an option to download data in CSV format.

| Bill of Materials | |
| Components | Quantity |
| Arduino Uno (MOD1) | 1 |
| Soil moisture sensor (S1) | 1 |
| USB cable for Arduino | 1 |
| Jumper wires (male to female) | As required |
The goal is to highlight how accessible tools—HTML, JavaScript, and Chart.js—can be used to build effective smart sensing systems. Designed for educational, experimental, or applied use, this setup serves as a strong foundation for exploring hardware-software integration.
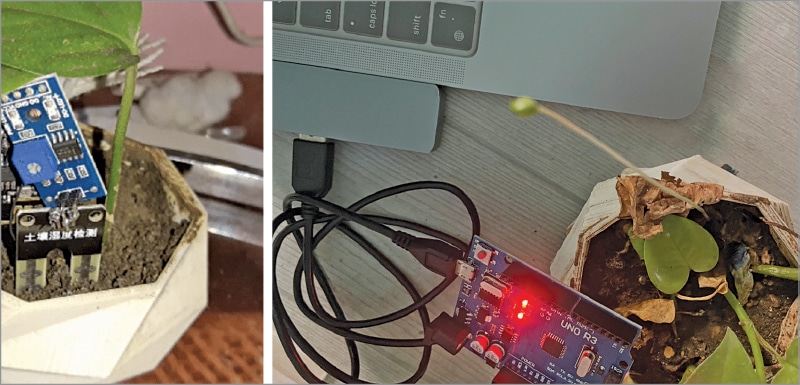
Fig. 1 shows the tested prototype in which soil sensor is in pot and Arduino is connected to laptop USB for data transfer. Refer to the Bill of Materials table to assemble the system. Fig. 2 shows the web page showing the data in real time with a graph.

Soil Moisture Monitoring with Arduino – Circuit Diagram
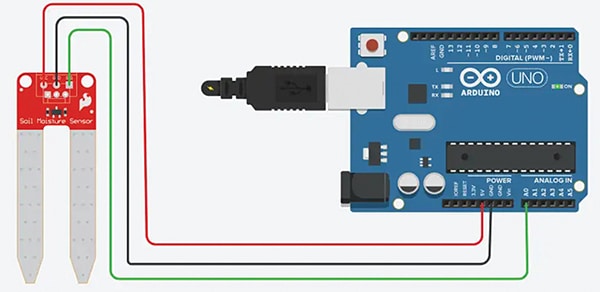
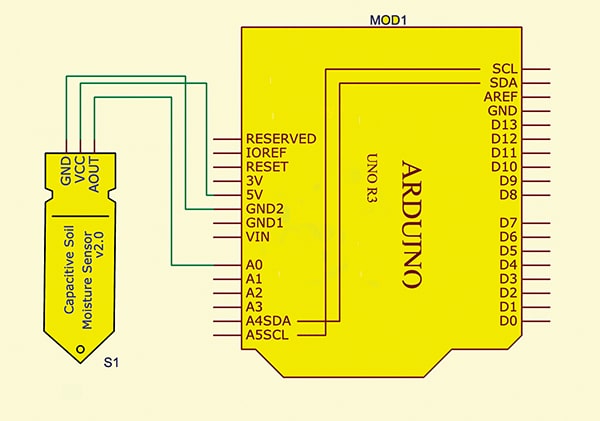
Fig. 3 shows the physical connection of the system, while Fig. 4 provides the schematic. In both diagrams, the sensor’s output signal pin is connected to A0 pin of the Arduino board. VCC and GND pins of the sensor are connected to the Arduino’s 5V and GND pins, respectively.
Software
Three sets of code are prepared for the system. The first is for the Arduino Uno, which collects sensor data and transmits it via the serial port. The second and third are for HTML and JavaScript, respectively. The HTML code defines the user interface, including the graph and control buttons, while the JavaScript code manages the serial port connection, processes the incoming data, displays it on the page and draws a graph, and allows users to download logged data in CSV format.
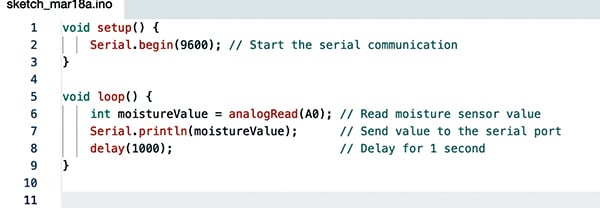
To begin, upload the Arduino code by selecting the appropriate board and port in the Arduino IDE. Fig. 5 provides a snippet of the Arduino code.
Web Application Setup