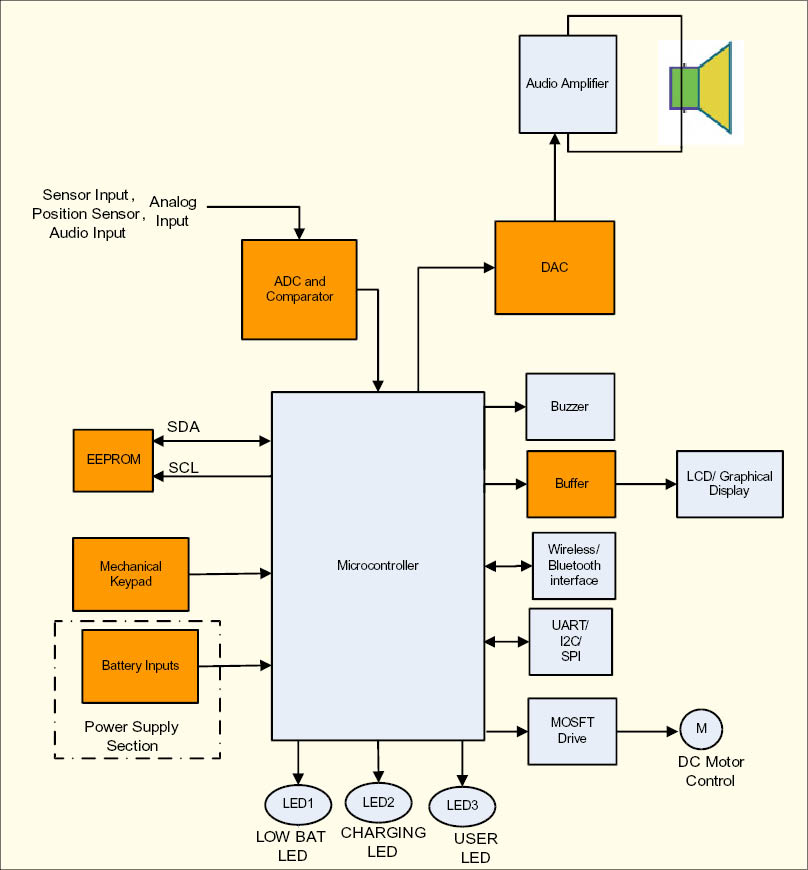
Microcontrollers in current Electronic toy applications is mainly used for IR interface, External EEPROM interface, Analog inputs using external ADCs and comparators, Battery input monitoring, Timer and clock interfaces, Controls front panel mechanical keypad and displays the results on LCD/ LED/ Graphical displays.
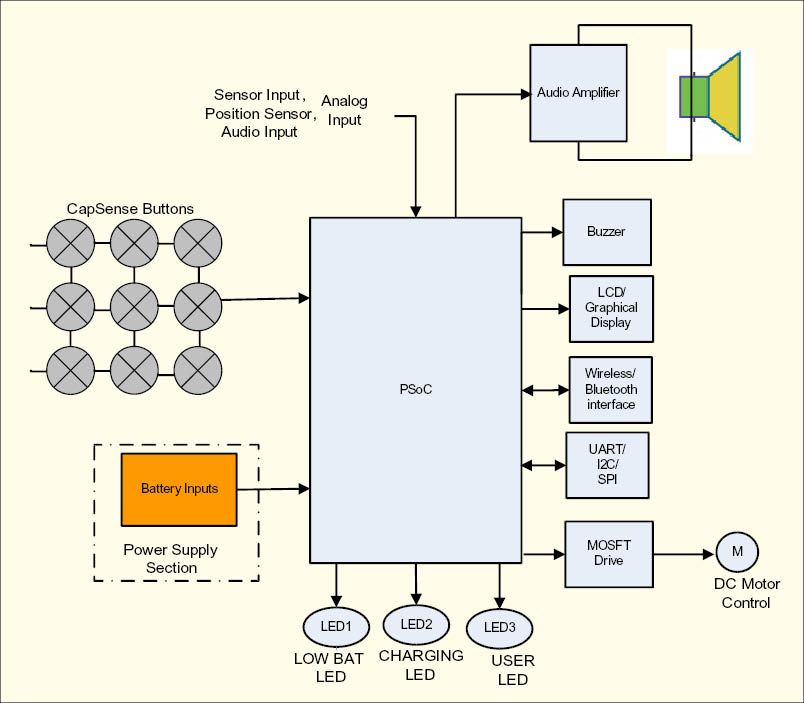
Programmable SOCs devices can be used in Remote Control System as a single board solution for IR interface, Battery input detection, Analog measurements. Direct drive LCD/ Graphical displays. Programmable SOCs devices supports CapSense technology which will replace mechanical buttons on the keypad.

Using IDE tool of SOC devices all the interface and logic can be designed. IDE tool is having readily available component block for designing the interface and logic like IR, ADC for analog inputs, PWM for Buzzer application, DAC, Segment, Character or Graphical LCD display support.
This article discusses role of MCUs and PSoC in Electronic toy applications. It also evaluates the system limitations and design challenges for these applications. With Programmable SOCs devices can reduce the complete product cost (by reducing the BOM cost) and project cost (Implementation in IDE Tool) in Electronic toy applications.
Theory
The current electronics toy applications uses 8/16 bit MCU for different functions like: motor control, LED/LCD/ Graphical display drive and different input and Output interfaces, Battery sensing and audio output. Microcontroller in CSP package is most commonly used in the Electronics toys applications.

MCU receives analog input signals from analog sensors (sensors which receives the analog inputs and provides the digital voltage which will be applied to the MCU), 2 axis / 3 axis accelerometer (Accelerometer measures the 2 axis / 3 axis movement and converts in to the digital voltage which will be applied to the MCU), MCU also uses the accelerometer and mechanical joystick for running gaming applications.
MCU uses external buffer driver circuitry to drive LED, LCD or graphical displays. Typically LCD or graphical display with backlight is used in the low end applications. It also controls the backlight of LCD and graphical displays. MCU uses touch screen controller for touch screen interface in high end applications.
MCU uses mechanical keypad for the user inputs in the low end applications. MCU uses CapSense/ touch screen based keypads in high end applications. MCU interfaces with other onboard peripherals (like camera interface controller) through I2C, SPI and UART interfaces.
The Toy applications are battery power operated, it uses coin cell or Li-Ion battery for the operation.
MCU monitors the coin cell and Li-Ion battery voltage and also used for battery charging application. MCU is also used for fault detection and data recovery applications.
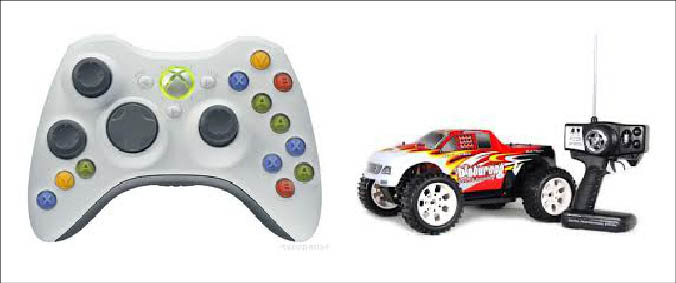
Microcontroller on proprietary 2.4GHz technology is targeted for remote controlled toys segments, gaming controllers and remote controlled toys segments are also witnessing customers shifting from IR to RF frequency range.
Implementation of PSoC in Electronics toy applications:
PSoC is a combination of a MCU with programmable logic and high-performance analog to digital conversions and commonly used fixed-function peripherals. The PSoC family is made up of 8bit (PSoC 1 and PSoC 3), and 32 bit MCUs (PSoC4 and PSoC5). They have flash memory up to 256KB, SRAM up to 64KB and internal EEPROM up to 2KB (flash can be used to emulate EEPROM). PSoC works on ultra low power mode. In low power mode it consumes <1µA current, making it useful when operating a toy in low power mode and with coin cell battery input.
PSoC has an internal RTC component for real time measurement. It does not require external clock/oscillator circuitry.
PSoC supports USB 2.0 interface, allowing the user to interface external memory through USB 2.0. It supports Secure Digital (SD) card interface.
PSoC has internal PWM, which is used for controlling and varying the tone of the buzzer for every key press in electronics toy applications. The duty cycle of the PWMs is varied based upon the speed required as set by the user through the GUI/ keypad interface. PSoC has an internal 8-bit DAC, which can be used for controlling speaker volume and also performs mute function for the audio speaker.
PSoC has internal Op-amp, Comparators and 12-bit 1MSPS Successive approximation ADC with differential and single-ended modes including sample-and-hold (S/H) capability which is used to measure different sensor inputs, Battery monitoring. So it does not require external amplifiers, ADC and comparators for electronics toy applications.
PSoC has operating rage of 1.71V to 5.5V so it can be easily interface with external peripherals for other applications. PSoC supports low operating voltage up to 1.71V and ultra low power (it consumes <1µA current) operation along with Hibernate and Deep Sleep modes which allow wakeup-time versus power trade-off it will help to support larger battery life/ power supply life. PSoC supports two independent run-time reconfigurable Serial Communication Blocks (SCBs) with re-configurable I2C, SPI, or UART functionality which will be helpful in internal and external peripheral communication. PSoC supports CapSense component which support manual and auto tuning which will be helpful in waterproofing application. PSoC directly drives LCDs and graphical displays for displaying different menu options. The PSoC Creator IDE tool has readily available component block for designing interface and logic like SARADC and PGA for analog sensors and other analog inputs. The PWM, CLK, MUX and Comparator components are used for electronics toy application. The character LCD and segment LCD components directly (does not require external buffers) drives LCD/graphical LCDs. It also has the RTC component for real time measurement. PSoC Creator has an internal system clock and does not require external clock/oscillator circuitry. The other components include Timer, Buzzer, CapSense, Segment LCD, Character LCD, Graphical LCD etc. PSoC Creator also enables the user to make use of an entire tools ecosystem with integrated compiler tool chains, RTOS solutions, and production programmers. With PSoC Creator and PSoC designer customers can create and share user-defined, custom peripherals using hierarchical schematic design. Customers can automatically place and route select components and integrate simple glue logic, normally located in discrete devices.
System Limitations and what could be improved using PSoC:
PSoC supports CapSense technology, which replaces mechanical buttons with a CapSense based keypad. This reduces failure due to mechanical buttons and provides better product reliability. PSoC Creator and PSoC Designer supports the CapSense SmartSense component (This CapSense algorithm that continuously compensates for system, manufacturing, and environmental changes), which auto-tunes the sensitivity of CapSense buttons and slider. So it does not require the manual tuning. PSoC supports waterproofing application. It will not detect the false trigger in with water drops and buttons operates in normal conditions with water drops. It ensures robust button performance even in noisy operating conditions. PSoC supports proximity detection using PCB trace, single wire, ganged button or single button implementations. So the front keypad will be activated when a user places the hand near the keypad. In the world of Cortex processors, the operating range is up to the 3.3V. PSoC supports operating rage of 1.71V to 5.5V. PSoC is available with programmable solution (It can be setup to implement a range of user-defined features) and configurable solution (It can implement specific features without the need for firmware development It can be hardware through resistors or through I2C register configurable) in electronics toy applications. With increasing the number of internal and external interfaces on the board is going to increase the number of ways that an intruder can create havoc on the system. Failure analysis and Returned materials is one of the single largest limitations of this embedded system will be solved by single chip solution.
Design Challenges:
The high performance intelligence microcontroller selection with higher MIPS CPU core, Faster ADC (>= 500Ksps @ 10-bit), Internal Flash and SRAM memory, Internal EEPROM, analog, and digital peripherals are required to perform key functions like high performance analog measurement, CapSense, Touch screen interface, LCD drive, Low power operation, RTC and Interfaces with different external protocols.
PSoC supports CapSense technology. Using PSoC in the design, CapSense based Button, Slider and proximity can be implemented for the front-panel design. Meeting CapSense performance (Signal to noise ratio) with nearby LEDs (PWM based) on front panel is a design challenge for system designer.
Implementing water proofing and water tolerance features are the design challenge for the system designer.
Implementing auto-tuning with variation in trace capacitance, variation in CapSense button and Slider sizes and shape are the design challenge for the system designer also implementing the CapSense sensing with thicker glass material (display glass) and meeting CapSense sensitivity with that type of materials is the design challenge for the system designer.
As this solution involves electro-mechanical construction, designing a compact and cost effective electro-mechanical solution is a design challenge for system designer. Certifying this electro-mechanical design with EMI/EMC standards is a design challenge for system designer.
Fault detection and recovery mechanism is required in electronics toy application. Power supply design with Battery protection, over-current, overheating, start-up fail condition is required for cell phone applications. Implementing Self Diagnostic in electronics toy application is a design challenge for the system designer.
A microcontroller with One Time Programmable (OTP) features prevents reverse engineering of the firmware by competitors and hackers.
Designing of electronics Toys for “Raster display”, “Bubble level” and “CapSense” applications using electronics board.
Electronics Toys can be used for Raster display, Bubble level, and CapSense applications, For example the PSoC based board can be used for the showing “Raster display”,” Bubble level” and ” CapSense” applications.
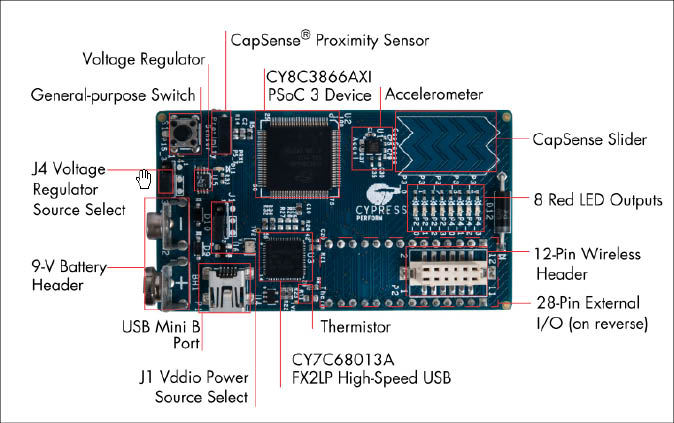
The components indicated in Figure4 are:
1. PSoC 3 100-pin TQFP (Cypress CY8C3866AXI-040 TQFP100)
2. CapSense Proximity sensor connector (Samtec Inc, BCS-101-L-S-HE)
3. Three-axis accelerometer (Kionix, KXSC7-2050)
4. Five-segment CapSense Slider
5. Bank of eight LEDs
6. Thermistor (Murata, NCP21XV103J03RA)
7. 12-Pin Wireless expansion connector
8. 28-Pin External I/O connector (22 GPIO, 2 VDD, 2 GND, 2 SIO)
9. USB programming and debugging interface (Cypress CY7C68013A-56LFXC)
10. USB connector
11. 9-V DC battery holder
12. Jumper J1 Vddio power source select
13. Jumper J4 voltage regulator source select
14. Voltage regulator (Zetex Inc, ZLDO330)
15. General-purpose push button switch
“PSoC ROCKs” raster image using PSoC board.
The board has a three-axis accelerometer. The accelerometer detects the instant acceleration of the board when in motion. The instantaneous voltage at each axis of the accelerometer is directly proportional to the acceleration along that axis. In the firmware Y axis voltage output of the accelerometer is routed to an ADC in the PSoC. This digital value is now a measure of acceleration detected by the accelerometer. If the acceleration exceeds a maximum value, it signals the start of a new wave event.
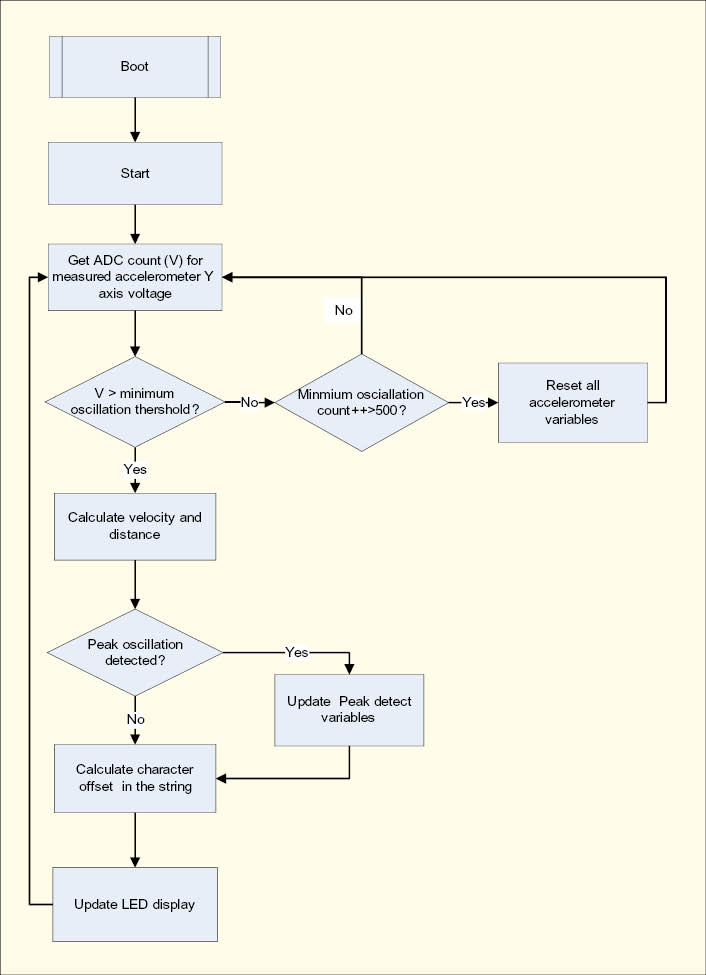
The firmware delays for a fixed period of time to start the first character in the proper position of the wave. The “PSoC ROCKs string is converted into a rasterized display data array before the start of the wave. Each column of the rasterized data array is sequentially output after a fixed delay. The delay periods may be adjusted in firmware. For a particular character in the message, a look up table determines which LEDs to turn on. When the board is waved back and forth rapidly, due to persistence of vision, the user defined image appears to float in the air. Multiple strings may be configured with each string being displayed for an adjustable number of wave cycles.
The “PSoCRocks” application displays a rasterized image of the user defined message (“PSoCRocks!”) using persistence of vision. Waving the circuit board back and forth quickly in the plane of the board generates the message.

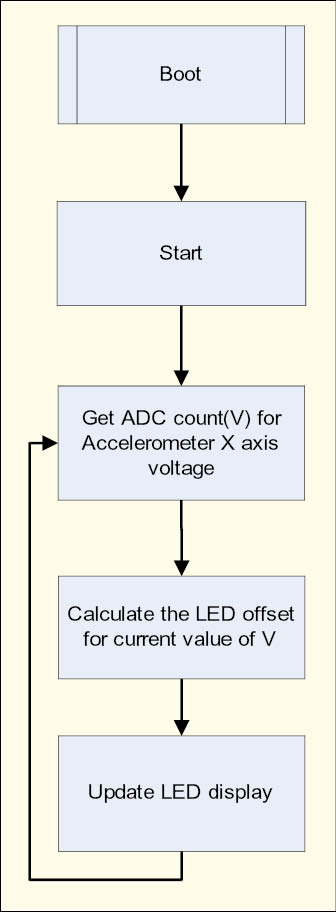
Bubble levels application using PSoC board
A bubble level displays the amount the level deviates from horizontal using a bubble of air in a glass via level. In Firmware project, a level is emulated by the accelerometer on the board. In bubble level detection, LEDs display the tilt of the board along its length (corresponding to the X axis of the accelerometer). The accelerometer is always under the influence of gravity. When the board is placed flat on the ground, the static acceleration due to gravity along the X axis of the accelerometer is zero. In this position, the two LEDs in the center of the LED display are turned on. Because the board is tilted in one direction, the force of gravity along that axis increases. This increases the static acceleration detected by the accelerometer. The X axis voltage output of the accelerometer is fed into an ADC in the PSoC. The ADC converts this voltage into digital count, which is the measure of the static acceleration detected by the accelerometer. PSoC determines the tilt of the board and lights up LEDs indicating the tilt. If the board is further tilted in one direction, the LED moves accordingly to the extreme of the LED display.
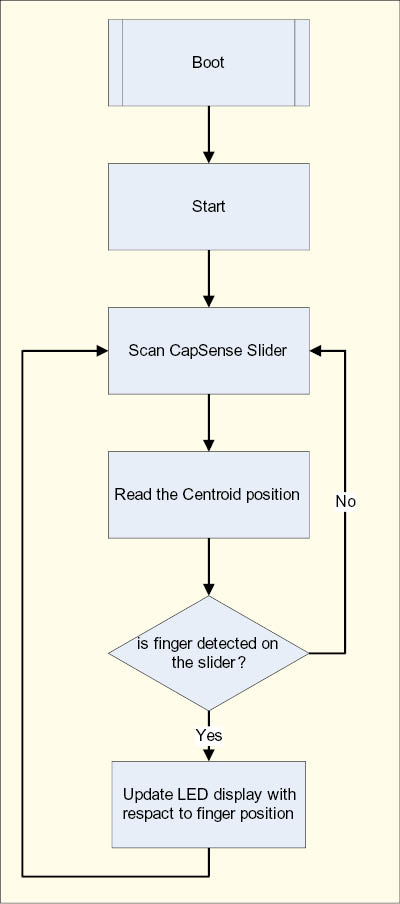
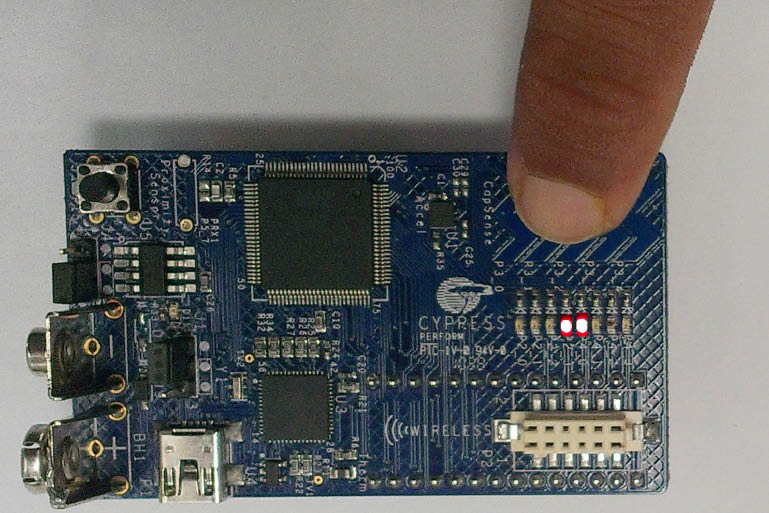
CapSense inputs using PSoC board.
Capacitive sensing determines the presence of a conductive element, such as the finger, on a capacitive sensor incorporated on the PCB. The kit consists of a bank of CapSense sensors in the form of a slider. The size of the sensors and their position is designed such that when a finger is placed on any part of the slider, at least three sensors are active (it detects the presence of the finger by a change in its capacitance value).

The CapSense component provides APIs, which report the centroid (relative position) of the finger on the slider based on the active sensors. The firmware then lights up the LED corresponding to this centroid position.
Conclusion:
Electronics toys are using microcontroller in current designs. PSoC is a combination of microcontroller and ASIC. PSoC provides an ease-of-use environment in Electronics toys applications. Using PSoC in these applications helps to reduce the product cost (by reducing BOM cost and design cycle time) and project cost (with PSoC Creator and PSoC Designer implementation).