


An experimental setup running in India was able to detect ionospheric changes that were associated with the volcanic eruption that occurred on 15th January this year in Tonga. The precursor nature could be observed as early as four weeks starting 17th December last year!
In January 2022, there was a sudden underwater volcanic eruption in the Kingdom of Tonga, a tiny island country in the South Pacific region. The event was captured by satellites and there have been reports of atmospheric, acoustic, and pressure waves observed following this event. This article reports for the first time from India about the ionospheric effects observed using very low frequency (VLF) radio wave propagation associated with this volcanic eruption.

The basics
The earth’s atmosphere is divided into two parts, the lower atmosphere that is close to the earth’s surface and the outer side that opens into the space and can be called the upper atmosphere. It is this upper atmosphere that gets ionised from the Sun’s x-rays and extreme ultra-violet radiations. Positive ions and negative charges (electrons) are generated as part of this ionisation process. This ionised layer is called the ionosphere.
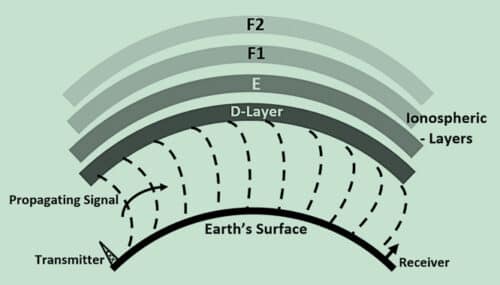
Depending upon the density and height of the atmosphere, there exists a gradient of number of electrons generated as a function of height. This leads further to various layers having different electron densities. Starting from the bottom to upward direction, the D layer is at approximately 60km-90km height. Next, the E layer is at around 90km-150km height, while F1 and F2 layers are at 150km-250km and 250-350km height approximately. During night, since ionisation stops, the recombination starts and the D layer vanishes while the F1 and F2 merge into a single F-layer.
Depending upon the frequency of operation in the LF/MF and HF range (30kHz to 30MHz), some layers absorb the radio signals while others reflect the signals. If a frequency is still higher, it simply passes through the ionosphere to the outer space. The D layer absorbs or attenuates most of the radio signals in HF band but the E, F1, and F2 layers reflect some of the frequencies. This varies depending upon time of the day, dawn and dusk conditions, etc.
The VLF signals are electromagnetic waves in the 3kHz to 30kHz frequency range with wavelengths ranging from 100km to 10km. Unlike the HF signals, however, the ionosphere acts as a reflector and helps in propagating these VLF signals in what is called Earth-Ionosphere-Waveguide-Mode of propagation.
It is the bottom of the ionosphere that is the D layer during day and E layer at night that forms one side of such a waveguide while the Earth’s surface forms the other side of the waveguide. Fig. 1 illustrates this concept. Thus, the VLF signals propagate over longer distances virtually un-attenuated. Therefore, these VLF signals are used for navigational applications.
Since these signals get reflected from the bottom of the ionosphere, monitoring the signal strength of VLF signals becomes a simple yet very effective and reliable tool for the remote sensing of the bottom of the ionosphere or simply the D layer or E layer. Any solar activity, such as solar bursts and coronal mass ejections (CMEs), have profound effect on D layer and enhancements in VLF signals are observed during such events.
Ionospheric disturbances in VLF propagation due to earthquakes, cyclones, and volcanoes are long been reported by scientists all over the world. However, such observations are reported only during or after such events.
The present work is therefore reporting for the first time observations of the pre-event signatures of a major volcanic eruption detected several weeks before the actual eruption: On 15th January 2022, an undersea volcano erupted in the small island country of Tonga in the South Pacific region, while the experimental setup running thousands of kilometres away in India was detecting abnormal changes since December 2021. This is a major scientific finding that reveals how and when the geophysical process of a volcanic eruption begins. It is a unique and first of its kind observation in this field.
The following sections describe in a systematic manner the experimental setup, data observed, and the findings after simple analysis of the data.
Experimental setup and data observational method
The experimental setup consists of VLF receiver tuned to 18.200kHz frequency. A square loop antenna of 1m×1m picks up the radio signal at this frequency and feeds to the receiver.
Fig. 2 depicts the block diagram of the receiving setup. The output from multiple VLF receivers tuned to different frequencies is fed to a data logger. The transmitter-receiver combination forms a VLF path in that specific direction. Receiving signals simultaneously with different frequencies and from different directions is therefore called the Multi-Path-Multi-Frequency VLF technique.
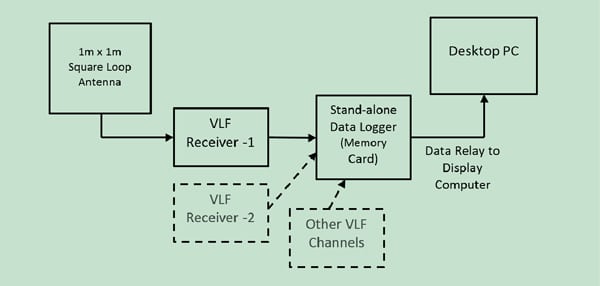
Each of the receivers actually acts as a tuned RF level indicator that gives a DC voltage proportional to the signal strength of the input RF/VLF signal from the antenna. This output voltage ranges from 0-10V DC for a signal input from -115dBm to about -55dBm with a noise floor at around -120dBm for each of these receivers. All receivers conform to same calibration curve for the input signal and output DC levels.
This output is then fed to a standalone datalogger with on-board storage on a memory card. At the same time, it relays data digitally to a local PC for real-time display purposes.
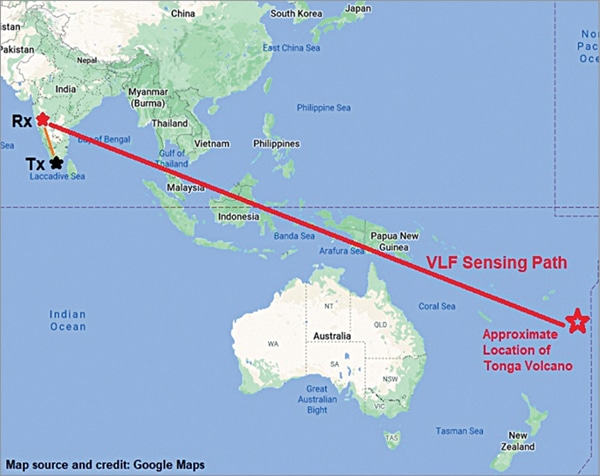
For the present case, the signal from VLF station VTX3 operated from India is monitored and the transmitter-receiver VLF path and the associated seismic and volcanic sensing zones are shown in the map in Fig. 3.
This setup runs and records data 24×7×365, except during power outages. As such, the data records the signal strength variations of each VLF channel as a function of the time of the day. For data analysis, data is sorted day-wise and collated month-wise. An average for each month is calculated and each day of that month is then compared and normalised with respect to this monthly average. This retains the original nature of the curves, yet it becomes easier to compare data set using basic statistical analysis.
For the present study and data analysis, two months were primarily selected—January 2022 and December 2021. January is the month during which the actual volcanic eruption occurred in Tonga while the previous month of December 2021 was added to trace back for any prior clues. When significant indications were noticed in the data set for these two months, data from two previous months, October and November 2021, were added for comparison purposes. The data for the month of February 2022 could not be included due to extended power interruptions during this month.
Understanding the observed data
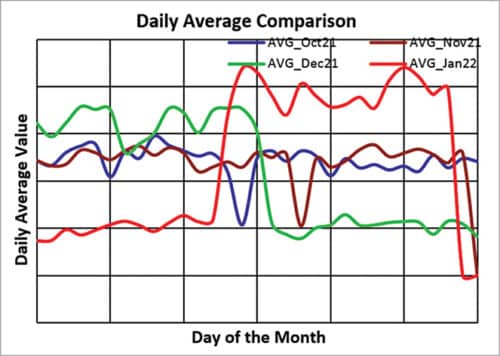
Before we begin to analyse the data, let us first have a look at the daily signal variations. Fig. 4 shows the monthly averages for the selected four months of October 2021, November 2021, December 2021, and January 2022. On X-axis is the time of the day as recorded in Indian Standard Time (IST) clock. On Y-axis is the DC voltage representing the RF signal strength variation of a particular VLF channel or receiver.
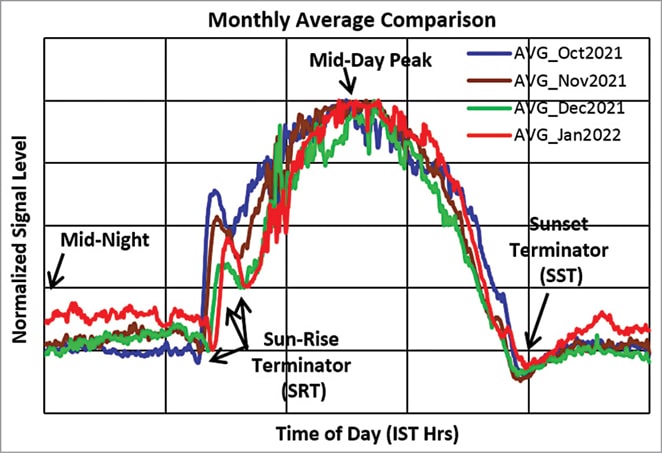
It should be noted that each day there can be several variations, including earthquake precursors, solar bursts, etc in the signal plots. Therefore, each individual day will have different variations, but with the averaged data a smooth curve is obtained while the nature remains the same and the main features—such as the sun-rise-terminator (SRT), mid-day/noon peak, and sunset-terminator (SST)—can be identified easily.
Data analysis and interpretations
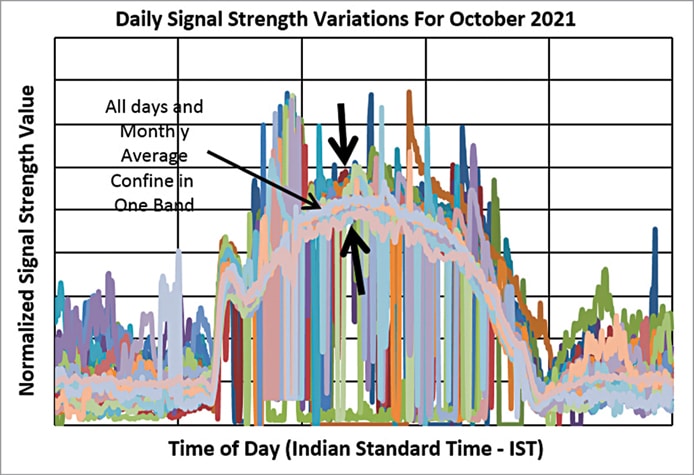
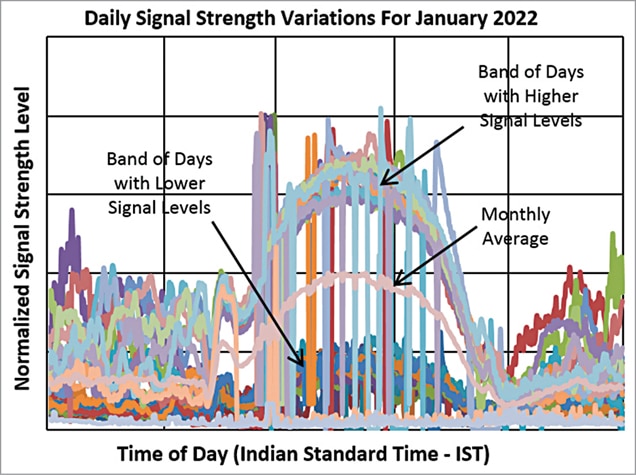
From the straight data plots for a day or even the monthly averages, it is not clear as to what changes have occurred in the signal variations over several days. However, if we plot all the days of a month, we can see some noticeable differences. Fig. 5(a) through Fig. 5(d) show all the day plots for the months of October 2021, November 2021, December 2021, and finally January 2022.
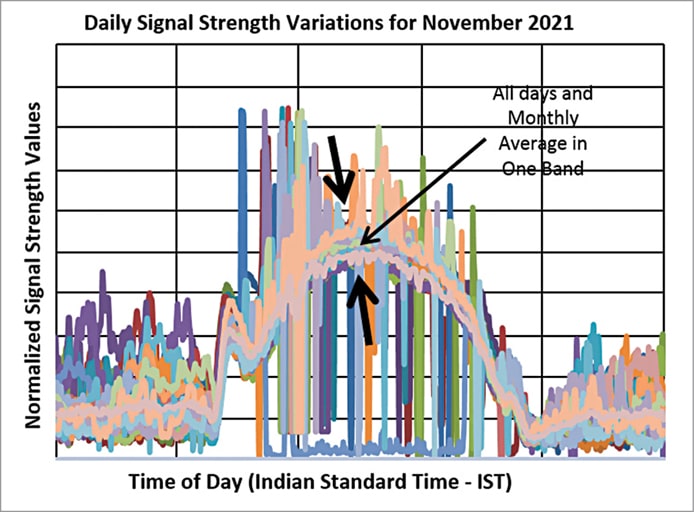
If we look at Fig. 5(a) and Fig. 5(b), the daily variations and the monthly average plots for October and November just form a single band. However, for the months of December 2021 and January2022, as shown in Fig. 5(c) and Fig. 5(d), it can be easily noticed that the average line lies in the middle, while some days form a band higher in magnitude than the average and some days are in another band that is below the monthly average line.
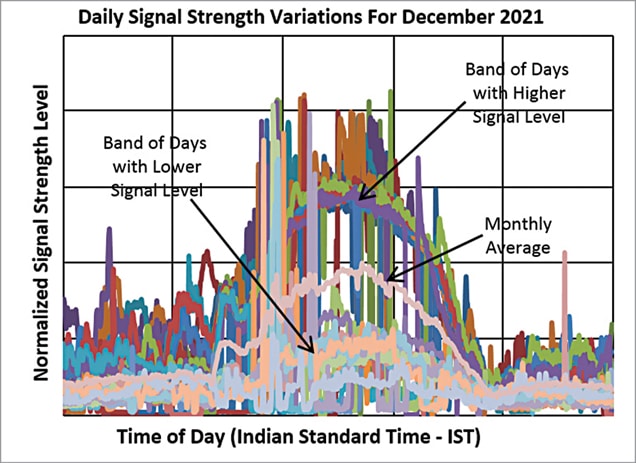
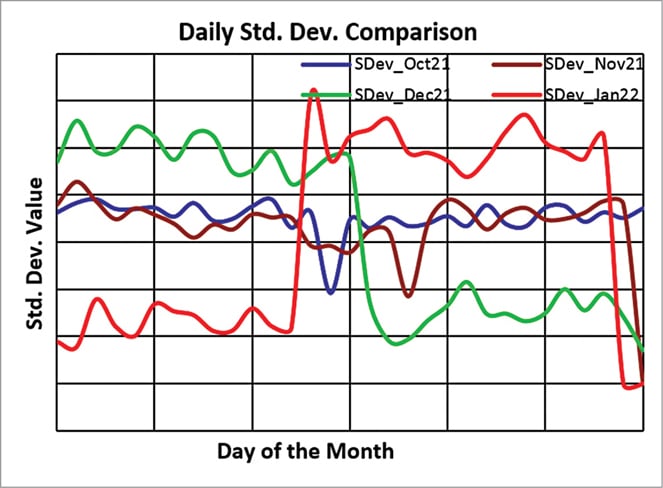
This clearly indicates that for some days, the signal variations were higher than average while for some days these were way below the average. Therefore, simple statistical parameter estimation for each of these days for all four months was carried out. These are minima, maxima, average, standard deviation, and the term delta, which is the difference between maxima and minima.
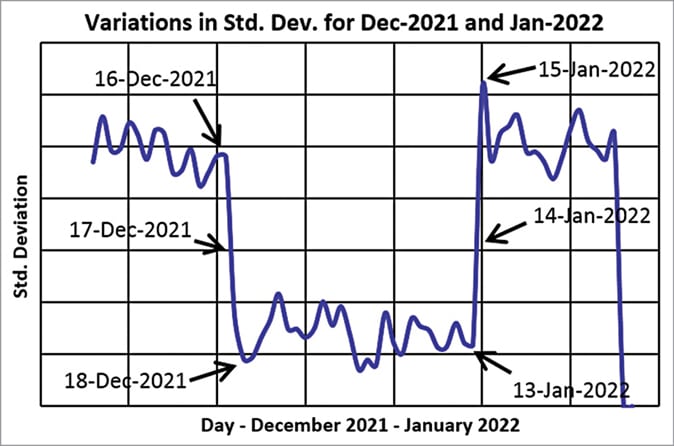
The following figures illustrate respectively daily averages for the four months. The average values or the standard deviation for December 2021 shows a significant difference and has revealed a shocking fact that the geophysical process associated with this volcano eruption started many weeks before. The process had begun almost a month in advance on 17th December 2021 and was terminated on 14th January 2022. Following this termination, on 15th January 2022, the volcanic eruption physically appeared on the sea-surface.
Comparison with earthquake precursors
By looking at Fig. 6(c) and Fig. 6(d), it was immediately clear that prior indications, that is, the precursors associated with major earthquakes, have identical shape of the signal strength variations and the same precursors are then used to predict earthquakes.

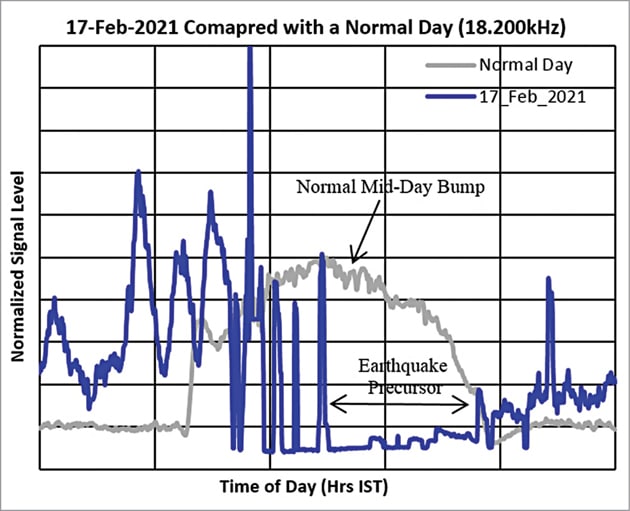
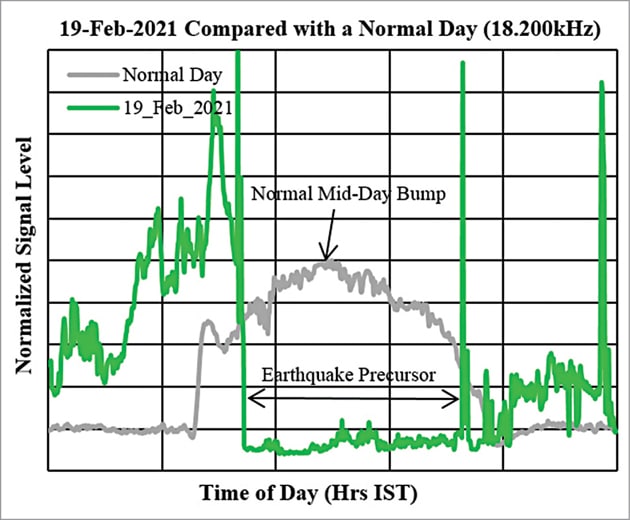
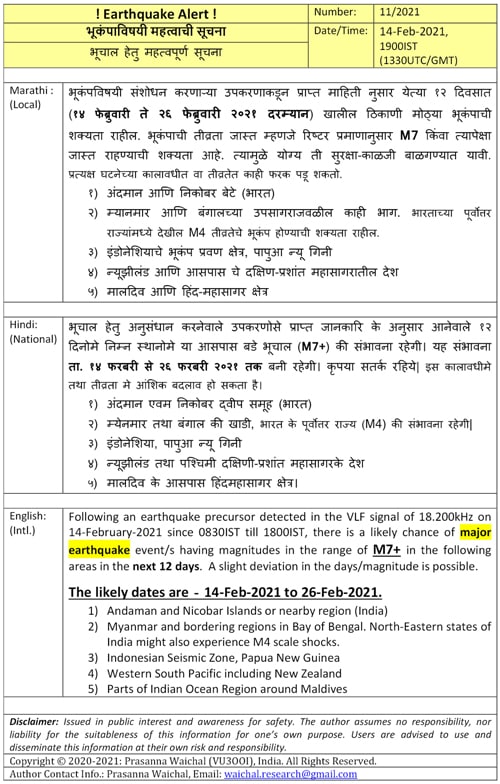
The following Fig. 7(a), 7(b), and 7(c) illustrate the precursors obtained on 14th, 17th, and 19th February 2021 that were later found to be associated with three major earthquakes of M7.3, M7.4, and M8.1 that took place on 4th March 2021 in the Kermadec Islands and New Zealand in the South Pacific region. Using the first detected precursor on 14th February 2021, the author had predicted the possibility of a M7+ earthquake and had issued an earthquake alert more than 14 days in advance, indicating the possibility of M7+ earthquake events in the South Pacific region, including New Zealand. See Fig. 8.
Notice the clear-cut similarities in the shape and pattern in signal strength changes, both during a volcano eruption as shown in Fig. 6(c) and 6(d) and a major earthquake as shown in Fig. 7(a), 7(b), and 7(c). There is always a drop in the VLF signal level as an indicator of these pre-volcanic or pre-seismic geophysical processes.
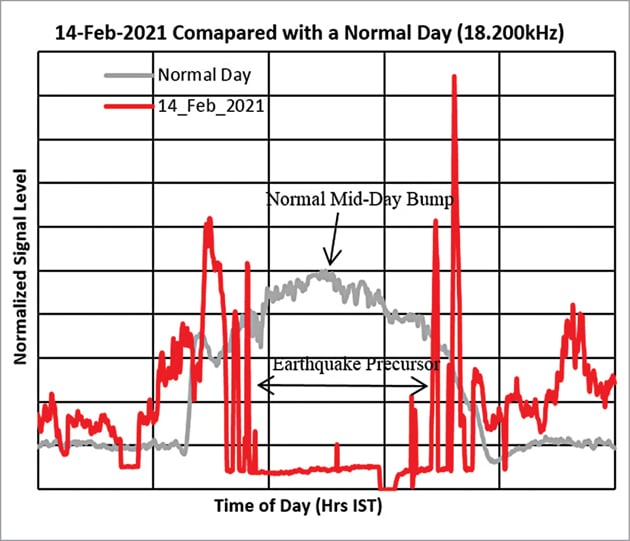
Also, notice that in comparison with Fig. 4, which shows a ‘normal’ curve, the mid-day peak is totally absent from these precursor days of February 2021, as shown in Fig. 7(a), 7(b), and 7(c). This is shown by the grey-scale curve in the plots.
What is shockingly observed is that the pre-indications or precursors related to an earthquake and a major volcanic eruption like this Tonga volcano are identical in nature but vary only in time scale. The geophysical process for a volcano can be thought as a slow-motion video where the speed is slower than normal. For an earthquake, the process can be thought as a fast-forward mode where the playback speed is higher than normal.
In other words, the process for a volcano continues for several weeks while that for an earthquake it is wrapped up in just a few hours’ time. But the nature of reduction in signal strength of a VLF radio wave is identical and therefore can be successfully used for the prediction of future earthquakes and volcanic eruptions alike.
Therefore, we can easily say that the geophysical processes associated with major earthquakes and volcanic eruptions are identical and generate ionospheric disturbances that reduce the magnitude of a VLF radio wave propagating using the earth-ionosphere-waveguide-mode of propagation. Such clues in future are undoubtedly going to change our understanding about these geophysical processes, and the VLF technique will certainly open a new branch of study for earthquakes and volcanoes.
Importance of these observations and findings
Natural hazards like earthquakes, tsunamis, and volcanoes pose a greater threat to the human life and property and modern infrastructures. We have some recent examples of the December 2004 Sumatra tsunami that hit the Indian and Sri Lankan coasts causing severe casualties. Similarly, the March 2011 Japan tsunami also had devastating impact in Japan, including damage to the Fukushima Nuclear Power Plant. Therefore, knowing about a possible forthcoming mega quake or a volcanic eruption would certainly be useful in minimising loss and damage to the human life and infrastructures.
With the present observations obtained with reference to the January 2022 Tonga volcano almost a month in advance, and the previously reported earthquake prediction of 4th March 2021 using advance precursors detected a few weeks earlier in February 2021, it is clear that the geophysical processes are sending clues and advance information to the ionosphere and such early signatures can be detected using the propagation of VLF signals.
Prasanna Waichal holds a master’s degree in electronics and has more than 25 years of work experience in industrial R&D for design and development of specialised and strategic electronics systems and academic teaching and research at post-graduate levels, both in India and abroad. His passions include radio reception and studying solar activities and their effect on ionosphere on earth. He is also a licensed amateur radio operator with call-sign VU3OOI. He claims to have discovered a method to predict earthquakes using very-low-frequency (VLF) multipath-multi-frequency propagation technique