


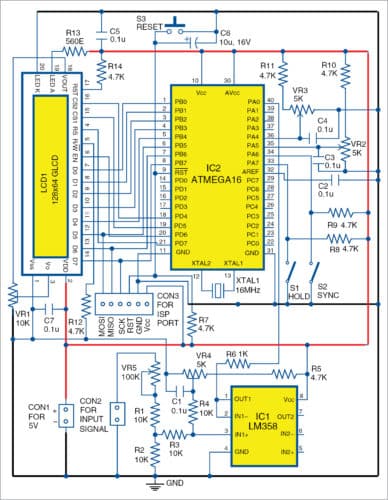
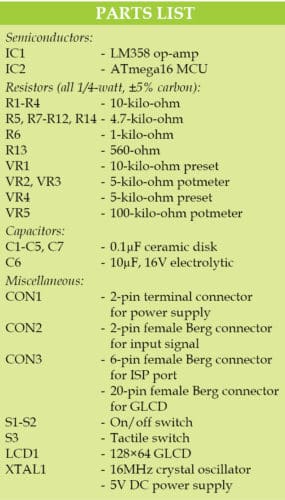
 This scope reads input signal and displays the output waveform on a graphical liquid crystal display (GLCD) having 128×64-pixel resolution. The signal is fed to ADC pin of ATmega16 microcontroller (MCU) through an operational amplifier (LM358). The ADC continuously reads the input voltage with preset delay and displays the same on GLCD scope. This circuit can measure the input frequency signal up to 250kHz.
Circuit and working of GLCD Scope
Circuit diagram of the simple GLCD scope is shown in Fig. 1.
GLCD
The GLCD (JHD12864E) has 0.48mm×0.48mm pixels size and approximately 6.6cm×3.3cm screen area. The screen is logically divided into two panes of 64×64 pixels on the left and 64×64 pixels on the right; this makes 128×64 pixels in total. The left-side pane is selected using CS1 pin, whereas the right-side pane is selected using CS2 pin. Data and command to GLCD are transmitted in 8-bit format by selecting RS pin settings as high and low, respectively. Contrast of the display is controlled at pin 3 of GLCD using preset VR1 connected between pin 18 (-10V DC) and ground (GND) of GLCD.

Sampling
ATmega16 is the heart of the circuit and signal voltage is read at its pin 40 (ADC channel 0 or PA0) based on the delay set as sampling time by potmeters VR2 and VR3.
Sampling time and sampling rate are displayed on top of the GLCD as delay between two samples in microseconds (µs) and samples per seconds (S/S). Frequency in Hz for the total screen (for 128 samples) is displayed at the bottom-left corner. Reference ADC voltage is selected as internal 2.56V and ADC clock is set as 250kHz. ADC converted value is of 8-bit accuracy (reads 0 to 255). The MCU reads 256 samples and displays selected 128 samples on the GLCD depending on the status of sync switch S2.
S2 is used for synchronising the signal with the display. If S2 is closed (logic low), then the display starts from the maximum value of 128 samples. On the other hand, if S2 is open (logic high), the program makes the MCU display the first 128 samples.
If hold switch S1 is closed (logic low), the program stops reading the signal value and the last sample data is continuously displayed. To continue sampling, open S1 (logic high).
LM358 is configured as the summing amplifier with unity gain. One of the inputs is set to have mid value of the maximum measurable voltage, that is, 1.28V, which can be adjusted using preset VR4. To adjust input voltage level, use VR5. Maximum input voltage is ±25V and can be adjusted to maximum readable signal using VR5 (100-kilo-ohm). Moreover, LM358 protects the MCU from high signal voltages. The program (GLCDscope.c) is developed and tested using AVR Studio 4 software. It can be compiled using AVR Studio 4 or above.
Once the circuit is ready, switch on the power. Set the fuse bits in the programming software and burn GLCDscope.hex file to ATmega16 through ISP port (CON3) using any AVR programmer.
Fuse bits
Set the fuse bits as follows for 16MHz crystal:
ckopt=on sut0=off sut1=off cksel0=off cksel1=off cksel2=off cksel3=off
where off means programmed and on means unprogrammed. (Refer to Atmel datasheet for full details.)
Self-test and calibration
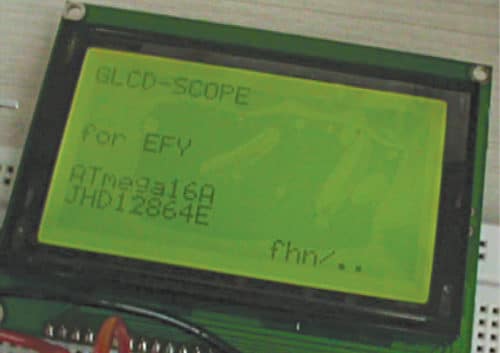
Initially, the GLCD shows text as shown in Fig. 2, followed by triangular patterns for a few seconds as self-test. It then starts reading the input ADC value continuously and displays the waveform along three horizontal lines—middle line being the zero-reference line, and top and bottom lines being reference lines of 50 per cent of maximum positive and negative voltages of the input signal, respectively. In case the display is not clear, adjust VR1 for contrast adjustment of GLCD. Now, connect (short) both signal input pins. A horizontal line should appear near the middle (zero-reference) line. Adjust VR4 to match both signal horizontal and zero-reference lines by varying VR5.
Disconnect (open) signal input lines and apply 5V DC to them. The signal horizontal line shifts up or down as per input 5V DC polarity. Adjust VR5 so that the signal horizontal line touches either top or bottom of GLCD screen. Repeat this process for 10V, 15V, 20V or as per the required voltage to be measured.
Construction and testing of Graphical LCD Scope
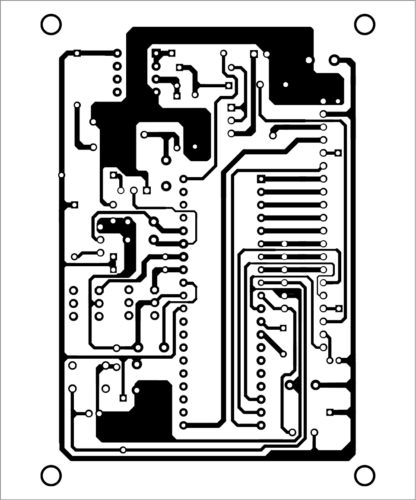
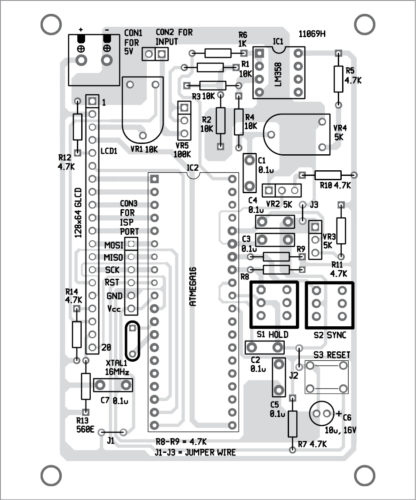
The PCB layout of the simple GLCD scope is shown in Fig. 2 and its components layout in Fig. 3. Assemble the components on the PCB as per the circuit diagram.
Download PCB and Component layout PDFs: click here
Download Source Folder: click here
Connect 50Hz or 60Hz AC signal from a step-down transformer (say, 6V AC) to signal input connector CON2. Set VR5 knob to about 10V range. Set VR2 and VR3 to minimum to get maximum samples per second. A sine wave will appear on the GLCD screen, as shown in Fig. 5.
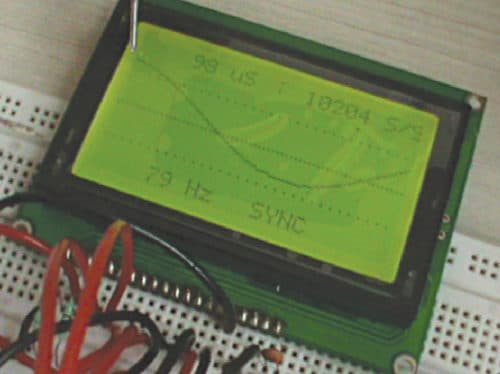
Adjust VR2 and VR3 to obtain about 50Hz frequency at the bottom, on the left side of the screen. One cycle of the AC waveform will be seen on the screen. To have static waveform, press S2. It will start displaying waveform from maximum voltage level. To stop reading input samples, close S1. You can press reset switch S3 momentarily at any point of time if there is a problem in the display.
Note
- GLCD scope can read 14285 (maximum) to 28 (minimum) samples per second. The value may have a slight variation due to the time taken to read ADC value by the MCU.
- Sampling time cycle is available at pin 22 and total sampling (256) time cycle is available at pin 23 of the MCU. You can compare these signals using a professional oscilloscope.
- It takes more time to read the signal as samples per second go down, that is, sample delays are increasing.
- Use 5V rechargeable battery (power bank) as power supply to make the system handy.
- Use 10-turn potmeter (preferred) as VR2 for easy control.
Fayaz Hassan is manager at Visakhapatnam Steel Plant, Andhra Pradesh. He is interested in MCU projects, mechatronics and robotics
Seems to be a very interesting project
however….
Where do we get the ” GLCDscope.hex file ” ?
thanks !
hex file plz
You can download the complete code from here: http://efy.efymag.com/admin/issuepdf/Make%20this%20simple%20graphical%20LCD%20scope.rar
The link that you mention above is incorect, it is a tacho project inside the zip file. Please correct it !
Thank you John, we have updated the article with correct links.
It’s the same thing. Incorrect zip file.
Hi Daniel, kindly elaborate your query.