
The software offers a way to track solar panel performance, identify issues, and improve efficiency, making solar energy management straightforward and effective.
Solar panels on roofs face various challenges, from tree branches shading them to potential damage from a neighbour’s baseball. However, solar panel owners now have a way to clearly understand their system’s performance thanks to a new software tool that transforms solar energy data into a comprehensive overview of power generation over time.

The SLAC National Accelerator Laboratory’s Grid Integration Systems and Mobility (GISMo) lab researchers have created Solar Data Tools. This software delivers a detailed analysis of solar system performance under varying weather conditions, pinpoints shading from surrounding buildings or plants, and identifies significant damage from incidents like hailstorms.
In developing their software, researchers amassed data from approximately 1,000 solar panel installations, capturing output every five minutes for three to ten years. This extensive dataset guided them in establishing a framework for their algorithms, prioritising minimal data input, reducing engineering requirements, and including error estimations. A pivotal method used in this process was signal decomposition, which analyses the power generation data collected by solar panel system loggers without needing external weather information. This approach effectively filters out the ‘noise’ to focus on the system’s performance, akin to discerning distinct sounds within a cacophony.
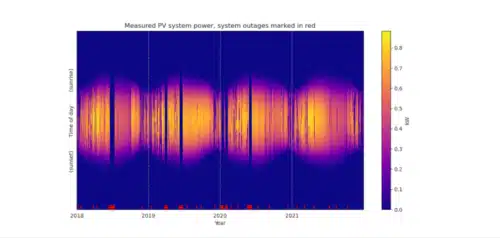
The outcome of their efforts is software enabling home solar systems and energy organisation owners to generate straightforward graphs detailing their power production over time. These visualisations pinpoint system failures or unexplained power fluctuations, offering a crucial initial step towards diagnosing and resolving system issues.

Looking ahead, the researchers aim to enhance the tool’s user-friendliness, enabling a broader range of users to interpret their solar data quickly through a mobile app. Currently, the software is best suited for users with technical expertise who can navigate the algorithms directly. To address this, the team focuses on developing a more intuitive app and a point-and-click interface to simplify access for users without technical backgrounds.