

Read Part 1
Over 20 billion connected devices expected in next five years will require a special class of processors that will have ultra-low-power and space requirements
More complex processors contain more performance-enhancing features such as large caches, prediction or speculation mechanisms, and out-of-order execution that introduce non-determinism into the instruction stream. Co-analysis is capable of handling this added non-determinism at the expense of analysis tool runtime. For example, by injecting an X as the result of a tag check, both the cache hit and miss paths are explored in the memory hierarchy. Similarly, since co-analysis already explores taken and not-taken paths for input-dependent branches, it can be adapted to handle branch prediction.

In an out-of-order processor, instruction ordering is based on the dependence pattern between instructions. While instructions may execute in different orders depending on the state of pipelines and schedulers, a processor that starts from a known reset state and executes the same piece of code will transition through the same sequence of states each time. Thus, modifying input-independent control flow graph (CFG) exploration to perform input-independent exploration of the data flow graph (DFG) may allow analysis to extend to out-of-order execution.
For complex applications, CFG complexity increases. This may not be an issue for simple in-order processors, since the maximum length of instruction sequences (CFG paths) that must be considered is limited based on the number of instructions that can be resident in the processor pipeline at once. However, for complex applications running on complex processors, heuristic techniques may have to be used to improve scalability.
In a multi-programmed setting (including systems that support dynamic linking), we take the union of toggle activities of all applications (caller, callee and the relevant OS code in case of dynamic linking) to get a conservative profile of unusable gates. Similarly, for self-modifying code, the set of usable gates for the processor is chosen as the union of usable gate sets for all code versions. In case of fine-grained execution, any state that is not maintained as part of a thread’s context is assumed to have a value of X when symbolic execution is performed for an instruction belonging to the thread. This leads to a conservative coverage of usable gates for the thread, irrespective of the behaviour of the other threads.

Bespoke processor design
Bespoke processor design is a novel approach to reducing processor area and power consumption without any degradation in performance. In this approach, a processor is tailored for an application such that it consists of only the gates required by the application for any possible execution with any possible inputs. A bespoke processor still runs the unmodified application binary without any performance degradation. Symbolic gate-level simulation-based methodology takes the original microprocessor IP and application binary as input to produce a design that is functionally-equivalent to the original processor from the perspective of the target application while consisting of the minimum number of gates needed for execution.
A large class of emerging applications is characterised by severe area and power constraints. For example, wearables and implantables are extremely area- and power-constrained. Several IoT applications such as stick-on electronic labels, RFIDs and sensors are also extremely area- and power-constrained. Area constraints are expected to be severe also for printed plastic and organic applications.
Cost concerns drive many of these applications to use general-purpose microprocessors and microcontrollers instead of much more area- and power-efficient ASICs, since, among other benefits, development cost of microprocessor IP cores can be amortised by the IP core licensor over a large number of chip makers and licensees. In fact, ultra-low-area- and power-constrained microprocessors and microcontrollers powering these applications are already the most widely used type of processing hardware in terms of production and usage, in spite of their well-known inefficiency compared to ASIC and FPGA-based solutions.
Given this mismatch between the extreme area and power constraints of emerging applications and the relative inefficiency of general-purpose microprocessors and microcontrollers compared to their ASIC counterparts, there exists a considerable opportunity to make microprocessor-based solutions for these applications much more area- and power-efficient.
The bespoke processor design methodology relies on gate-level symbolic simulation to identify gates in the microprocessor IP that cannot be toggled by the application, irrespective of the application inputs, and automatically eliminates them from the design to produce a significantly smaller and lower power design with the same performance. In many cases, reduction in the number of gates also introduces timing slack, which can be exploited to improve performance or further reduce power and area. Since the original design is pruned at the granularity of gates, the resulting methodology is much more effective than any approach that relies on coarse-grained application-specific customisation.
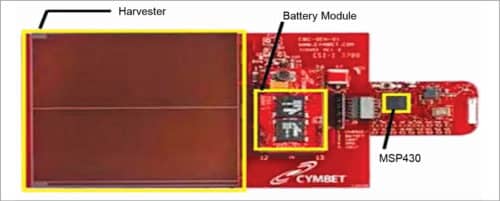
This methodology can be used either by IP licensors or IP licensees to produce bespoke designs for the application of interest. Its simple extensions can be used to generate bespoke processors that can support multiple applications or different degrees of in-field software programmability, debuggability and updates.In the world of ultra-low-power applications, power is everything. There are three basic types of systems depending on the sources of power:
1. Systems powered directly by energy harvesting (for example, a solar cell)
2. Systems powered by a battery, which, in turn, is charged via energy harvesting
3. Systems that just have a battery
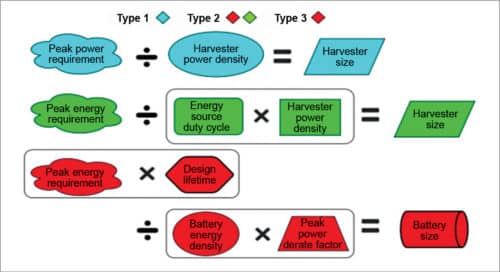
It’s the size of energy harvesting and/or energy storage (battery) components that ultimately determines the form factor, size and weight of an ultra-low-power device. Peak power and energy consumption impact harvester and battery size calculations in different ways depending on the type of device.
Current approaches for determining peak power and energy
There are three basic approaches for determining the peak power and energy requirements of an ultra-low-power processor for a given application. For a very conservative upper bound, look at the datasheets for the processor, which tell the peak power that can be consumed by the hardware. Run a stress mark—an application that attempts to activate the hardware in a way that maximises peak power or energy. A stress mark may be less conservative than a design specification, since it may not be possible for an application to exercise all parts of the hardware at once. Perform application profiling on the processor by measuring power consumption while running the target application on the hardware.
Things tend not to work out well if a processor tries to operate outside of the peak power and energy bounds available to it. So the best practice is to add a guard band (power buffer) to any profiling-based results. A typical guard banding factor might be 33 per cent. In other words, take the profiling results, add 33 per cent and provision for that.
Input-independent peak power and energy profiling
The core idea is to run a symbolic simulation of an application binary on the gate-level netlist of a processor. Most ultra-low-power systems tend to have simple processors and applications, making simulation feasible. For example, even the most complex benchmark may complete full simulation in two hours.
During simulation, a special X value is propagated for all signal values that can’t be constrained based on the application. Start with all gates and memory locations not explicitly loaded with the binary set to X. Any input values during simulation are also set to X.
As simulation progresses, the simulator dynamically constructs an execution tree describing all possible execution paths through the application. If an X symbol propagates to the inputs of the program counter (PC) during simulation, indicating an input-dependent control sequence, a branch is created in the execution tree. Normally, the simulator pushes the state corresponding to one execution path onto a stack for later analysis and continues down the other path.
At the end of this process, you know the activity of each gate at each point in the execution tree. A gate that is not marked as toggled (0 to 1, or 1 to 0) at a particular location in the tree can never be toggled at that location in the application. You can use this knowledge encoded in the execution tree to generate peak power requirements as follows:
1. Concatenate all of the execution paths into a single execution trace.
2. Assign all of the Xs in the trace such that power for each cycle is maximised. Power is maximised when a gate toggles, but a transition requires two cycles—one to prepare and the other to make the transition. Since you don’t know the best way to align transitions with cycles, two separate value-change dump (VCD) files are produced; one maximises power in all even cycles and the other maximises power in odd cycles.
3. Combine the even and odd power traces into a single peak power trace by taking power values from even cycles in the even trace, and odd cycles in the odd trace.
4. Peak power requirement of the application is the maximum power cycle value found in the peak power trace.
5. When making this calculation, for input-dependent branches the algorithm always take the most expensive one. For loops where the maximum number of iterations can be determined, simply take the energy for one iteration and multiply it by that maximum number. If neither is possible, it may not be possible to compute the peak energy of the application; however, this is uncommon in embedded applications.
6. Results. By accounting for all possible inputs using symbolic simulation, this technique can bound peak power and energy for all possible application executions without guard banding. Peak power requirements reported by the technique are 15 per cent lower than guard-banded application-specific requirements, 26 per cent lower than guard-banded stress-mark-based requirements, and 27 per cent lower than design-specification-based requirements. On an average, the peak energy requirements reported by the technique are 17 per cent lower than guard-banded application-specific requirements, 26 per cent lower than guard-banded stress-mark-based requirements, and 47 per cent lower than design-specification-based requirements.
Optimising peak power guided by profile results
The technique can also be used to guide application-based optimisation by analysing the processor’s behaviour during the cycles of peak power consumption. Three different optimisations can then be applied as appropriate:
1. Replace a complex instruction that induces a lot of activity in one cycle with a sequence of simpler instructions, thus spreading out the activity over several cycles
2. Delay the activation of one or more modules, previously activated in a peak cycle, until a later cycle
3. Avoid the multiplier being active simultaneously with the processor core by inserting a no-operation instruction (NOP) into the pipeline during the cycle in which the multiplier is active
Taking combined figures across the benchmarks, these techniques reduced peak power by up to 10 per cent (5 per cent on average) with up to 34 per cent (18 per cent on average) reduction in peak power dynamic range.
High-level synthesis
High-level synthesis (HLS) tools such as Cadence Stratus and Mentor Catapult help to generate hardware for a given application. However, unlike bespoke processor design, HLS involves additional development cost since a new high-level specification of application behaviour needs to be defined and the high-level specification itself needs to be verified. Besides, while HLS tools can transform many C programs into efficient ASICs, there are well-known limitations that further increase development costs.
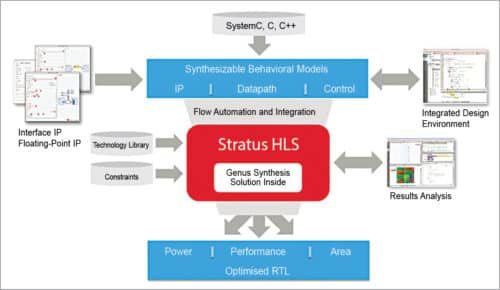
Cadence Stratus
Cadence Stratus HLS delivers up to ten times better productivity than traditional RTL design. It lets you quickly design and verify high-quality RTL implementations from abstract System C, C or C++ models. Using the platform, you can reduce the intellectual property (IP) development cycle from months to weeks.
You can easily create abstract models using Stratus HLS’ integrated design environment (IDE) and synthesise optimised hardware from those models. You can then retarget these models to new technology platforms and reuse them more easily than you could with traditional hand-coded RTL. You can actively make tradeoffs between power, area and performance from within the HLS environment. Users have reported productivity as high as two million verified gates/designer/year compared to 200,000 with the traditional RTL flow.
Mentor Catapult
The Catapult HLS platform empowers designers to use industry-standard ANSI C++ and SystemC to describe functional intent and move up to a more productive abstraction level. From these high-level descriptions, Catapult generates production-quality RTL. By speeding time to RTL and by automating the generation of bug-free RTL, it significantly reduces the time to verified RTL.
The Catapult platform pairs synthesis with the power of formal C property checking to find bugs early at the C, C++ or SystemC level and to comprehensively verify source code before synthesis. Its advanced power optimisations automatically provide significant reductions in dynamic power consumption. The highly-interactive Catapult workflow provides full visibility and control of the synthesis process, enabling designers to rapidly converge upon the best implementation for power, performance and area.
Dynamic memory allocation, pointer ambiguity, memory parallelism extraction and efficient schedule creation for arbitrary C programs are all challenges for HLS. In fact, most commercial tools limit the use of pointers and dynamic memory allocation, requiring additional hardware-aware design development to create a working ASIC from a C program.
In contrast, a bespoke processor tool flow automatically creates a bespoke processor from the original, already verified gate-level netlist and application binary without further design work. Also, unlike HLS, it can generate a design that supports multiple applications on the same hardware (including full-fledged OS) and can support in-field updates. Thus a bespoke processor design flow can decrease design and verification effort and allow increased programmability compared with HLS tool flows.
Applications
Statically-specialised cores such as conservation cores, QsCores and GreenDroid automatically develop hardware implementations that are connected to a general-purpose processor at the data cache and target hotspots within an application code. GreenDroid, a prototype mobile application processor chip leverages ‘dark silicon’ to dramatically reduce energy consumption in smartphones. It provides many specialised processors targeting key portions of Google’s Android Smartphone platform. GreenDroid reduces energy consumption for these codes by integrating conservation cores (c-cores). Such cores increase energy efficiency at the expense of increasing the total area of a design, and thus may not be a good fit for area-constrained applications.
Reconfigurable architectures such as DySER can also increase energy efficiency by mapping frequently-executed code segments onto tightly-coupled reconfigurable execution units. However, increased energy efficiency comes with an increase in area and power for the additional reconfigurable units.
Extensible processors, such as Xtensa, allow designers to specify configurations including structure sizing, optional modules and custom application-specific functional units. Such extensible processors are limited in the extent to which these can reduce area and power, since they are applied primarily at the module level. Furthermore, the process is not fully automated and requires additional hardware design effort.
Compared with extensible application-specific processors, bespoke processors can reduce power further as these can remove gates within modules and require less manual design effort. Chip generators can be used to generate chip families from the ground up for a particular application domain by allowing domain expert hardware designers to encode domain-specific knowledge into tools that design application-specific chips within the same domain.
Like HLS, this approach still requires a domain expert to design the overarching hardware in an HLS-like manner and then specify functions that allow arbitrary elaboration of the hardware design (for example, encoding optimisation functions for determining lower-level parameters such as cache associativity). Therefore chip generators require a change in the design process, while tailoring bespoke processors to applications can be completely automated from a program binary and processor netlist.
Simulate-and-eliminate attempts to create a design tailored to an application by simulating the target application with a user-provided set of inputs on multiple base designs. Logic and interconnect components that are not used by the application are removed.
Simulate-and-eliminate differs from bespoke processors in three fundamental ways—level of automation, scope of elimination and correctness guarantees.
First, simulate-and-eliminate requires significant user input to guide the selection of core parameters, selection of bit widths and definition of optimisations. Bespoke processors require no user intervention.
Second, simulate-and-eliminate only considers high-level, manually-identified components when determining what is used by a processor, and consequently does not achieve as large of area and power reductions as fine-grained bespoke processor tailoring.
Third, simulate-and-eliminate relies on user-specified inputs to determine components that are never used by an application. This means it cannot guarantee safe optimisation for applications where inputs affect control flow. Additionally, simulate-and-eliminate cannot determine whether an unsafe elimination is performed. Bespoke processor tailoring guarantees correctness by considering all possible application inputs when determining which gates to remove.