
In an era where sustainable farming and efficient resource management are paramount, the Soil Moisture Mapping project emerges as an innovative, low-cost solution for monitoring environmental conditions across agricultural lands.
Powered by the IndusBoard Coin—a compact, WiFi-enabled microcontroller—this project enables real-time tracking of soil moisture, light intensity, and temperature across a divided land area (up to 30 sections).
Operating in Access Point (AP) mode, the IndusBoard creates its own standalone WiFi network, eliminating the need for external internet connectivity. Users can connect via any device—smartphone, tablet, or laptop—and access a user-friendly web interface to view live data, record readings for specific land sections, and visualize moisture levels on a color-coded grid.
This setup is ideal for farmers, researchers, and hobbyists interested in precision agriculture. Sensor readings update every second, allowing quick data capture with a single button press. The system assigns current values to the selected land section and automatically moves to the next, while displaying averages, the driest area, and a 5×6 grid where colors range from light blue (wet soil) to deep blue (dry soil).
Additional features include an input field for land area in square meters, contextualizing data for larger plots. Leveraging the IndusBoard’s robust IoT capabilities, the project enables data-driven decisions for irrigation, planting, and soil health analysis in a portable, easy-to-deploy package.
The project is built using affordable components: the IndusBoard Coin as the core, a capacitive soil moisture sensor, a light sensor (XYC-PT19C-L1), and an LSM303AGR accelerometer module (which includes a temperature sensor). The complete setup can be assembled in under an hour and costs less than $50, making it accessible for educational purposes or small-scale farming.
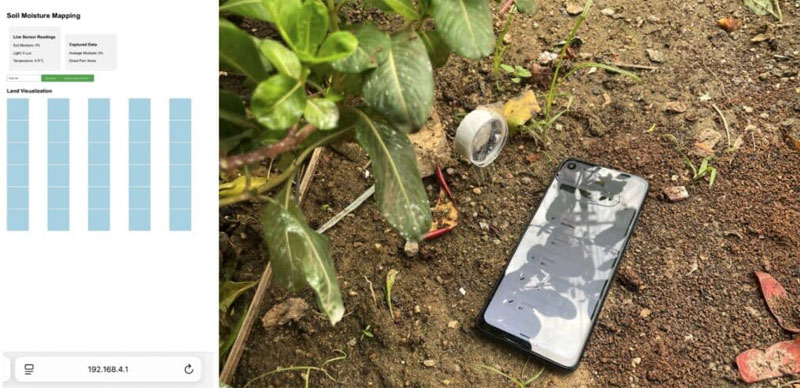
Table of Contents
Bill of Materials
The complete list of components needed for the project is presented in Table 1. Here, the IndusBoard Coin is used due to its compact size and built-in sensors that we require. Along with that, a soil sensor is used. You have two options:
- Use one sensor and map the land moisture by inserting the sensor at different locations and taking readings one by one. However, this will not provide real-time data, and you will need to do it manually each time.
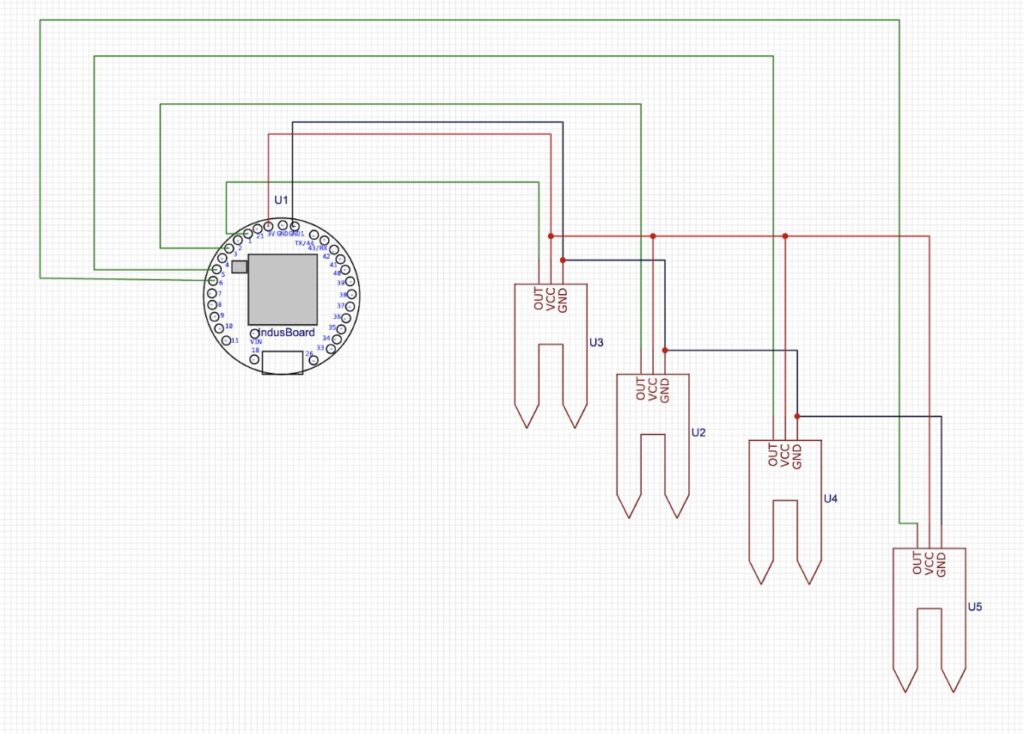
- Use 10–12 soil sensors and deploy them across the land at defined distances, depending on your land size, which can be divided into rows and columns. This method allows for real-time monitoring of soil moisture.
| Components | Quantity |
| IndusBoard | 1 |
| Soil Moisture sensor | 1 or 10 and more. |
| USB Cable | 1 |
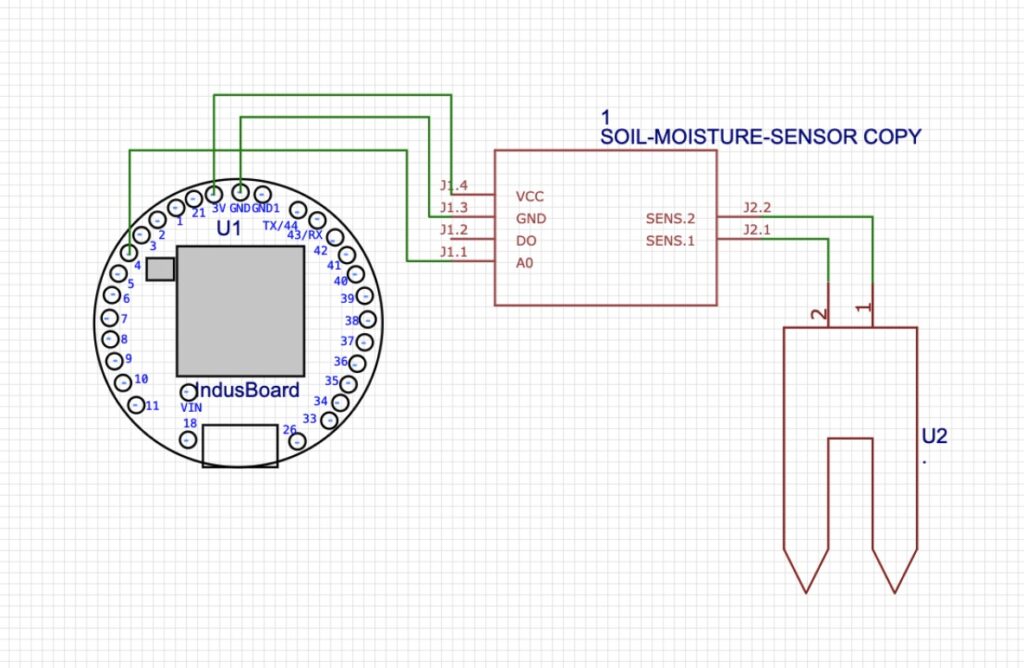
Circuit for Soil Moisture Mapping
The connection is very simple, as most of the sensors are already built into the IndusBoard Coin. You can connect the soil sensor signal pins to the I/O pins of the IndusBoard, such as pins 1, 3, 4, 5, 6, 11, 12, 13, 14, etc.
The IndusBoard Coin can be powered using a 3.3V battery, or alternatively, you can use a 3.3V solar panel for off-grid applications, depending on your needs.
Soil Moisture Mapping Programming
The code is modular, allowing easy customization. Here’s where and how to configure key elements:
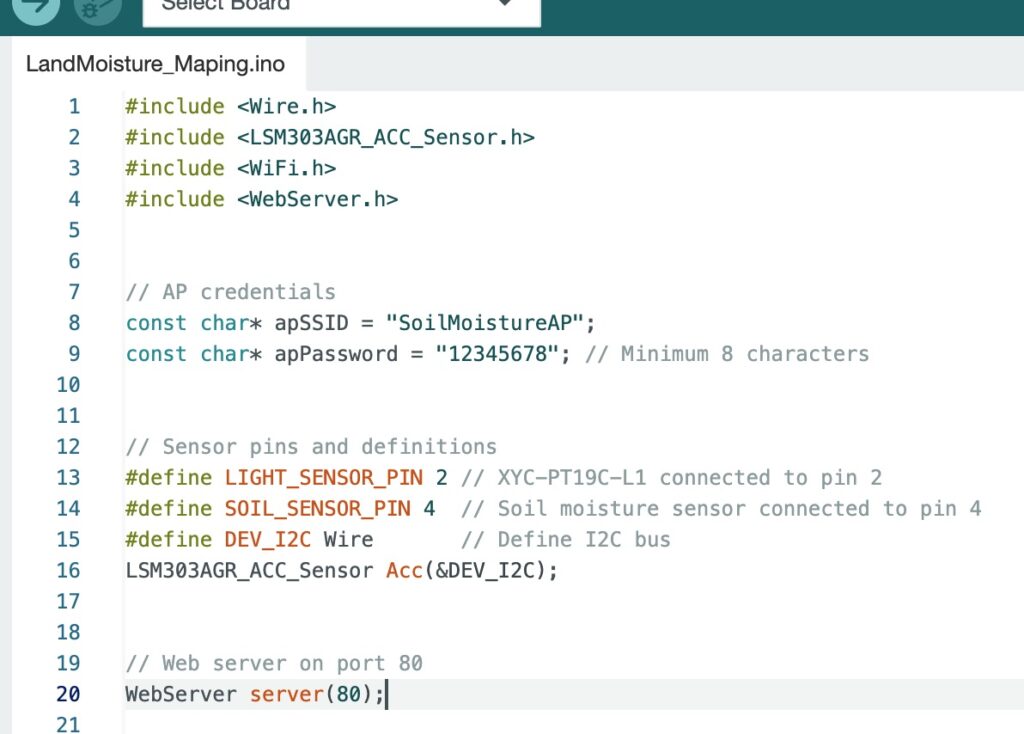
1. Wi-Fi AP Mode, SSID, and Password
- Locate the constants at the top of the code:
const char* apSSID = "SoilMoistureAP"; const char* apPassword = "12345678"; - Change
apSSIDto your desired network name (e.g.,"MyFarmMonitor"). - Update
apPasswordto a secure password (at least 8 characters for WPA2 security).
The AP is enabled in setup() using:
WiFi.softAP(apSSID, apPassword);
If you want to switch to station mode (connect to an existing Wi-Fi network), replace this with:
WiFi.begin(yourSSID, yourPass);
Note: This would require internet for remote access and changes the project’s standalone nature.
2. Sensor Pins
- Soil sensor:
#define SOIL_SENSOR_PIN 4– Change to another analog pin if needed. - Light sensor:
#define LIGHT_SENSOR_PIN 2– Adjustable as needed. - Temperature: Uses I2C; no pin change is needed unless you rewire.
3. Calibration and Mapping
- Soil moisture mapping:
map(soilAdc, 0, 4095, 100, 0)Maps 0 (wet) to 100 (dry). Calibrate by testing in dry/wet soil and adjusting the range. If your sensor is inverted, swap 100 and 0. - Light:
(lightAdc / 4095.0) * 1000.0Scales to 0–1000 Lux. Adjust the multiplier based on your sensor’s sensitivity. - Temperature: Directly from
Acc.GetTemperature(¤tTemp);– Verify accuracy with a thermometer.
4. Land Parts and Grid
- Arrays are sized for 30 parts. Change by updating array sizes:
float soilMoisture[50];Also update loops for HTML generation and calculations. - Grid layout: 5×6 in CSS. Adjust
grid-template-columns: repeat(5, 1fr);for different layouts.
5. Default Land Area
- Set the initial land area:
float landArea = 1000.0;
6. Other Customizations
- Add more sensors: Include code in
handleLiveData()and update HTML/JSON. - Security: For production, consider adding authentication to the web server (e.g., HTTP basic auth).
- Data Export: Extend
handleCapture()to log data to Serial or an SD card (if added).
Testing
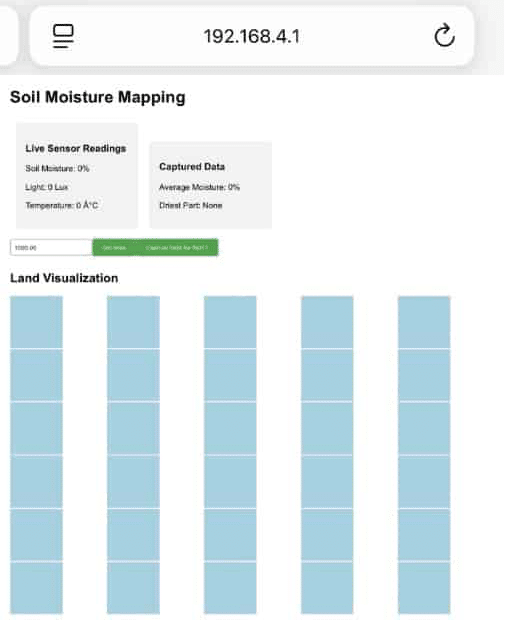
Now, power the device and connect to its Access Point (AP). Open a browser and enter the device’s IP address to access the dashboard, which displays a land rectangle and an input field for the land area.
- Set your land area.
- Select each small section of the land and take readings.
- Repeat this process for different parts of the land.
The system will then calculate the dry and moist areas and provide an overall soil moisture profile for your land.