
In various industries and applications, it’s crucial to monitor the current and frequency of devices in real-time. These parameters are vital for the longevity of frequency-sensitive appliances. Moreover, research-based or AI model training systems require real-time data logging for analysis and model training. Unfortunately, most ammeters and multimeters lack the capability to record data in real-time and save it for ML model training or research purposes. Even in other applications, data visualization, monitoring, and recording are essential.
Our solution addresses this problem by designing a web app that connects to an ammeter device. This app displays real-time ammeter data, generates real-time graphs, and provides an option to record and download data in CSV or TXT format for research or ML model training. The device uses the Web Serial API to connect via the USB port. However, our device is capable of wireless data display and recording using WiFi, which can be modified if desired.
The sensor used in this setup is the ACS712 current sensor, which can measure both AC and DC current. While it offers good accuracy, for precise measurements, you can replace the sensor and modify the code accordingly. The current circuit is suitable for most high-load appliances. The sensor comes in three variants: 5A, 20A, and 30A. In this case, we’ve used the 5A variant, but you can adjust the code based on the chosen sensor variant.
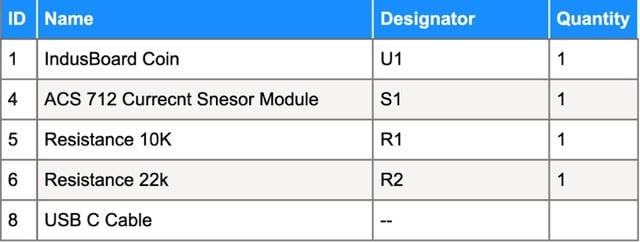
Bill of Material
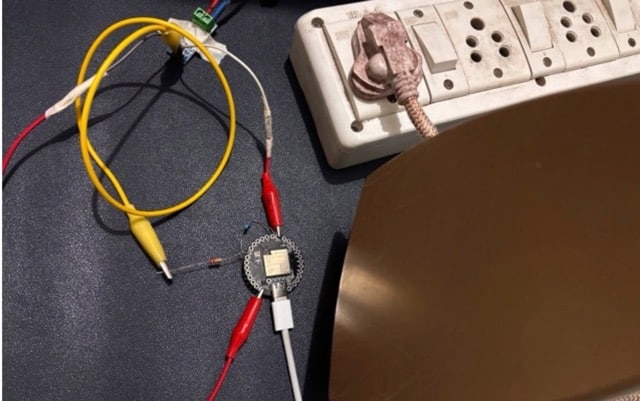
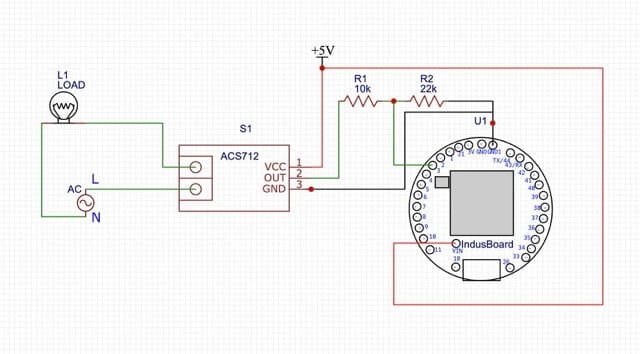
Circuit for AC Current and Frequency Measurement
The sensor uses 5V logic, while the IndusBoard Coin we are using operates on 3.3V logic, so we need to add a voltage divider circuit using two resistors. In the code, I have used and tested 10kΩ and 22kΩ resistors or 10kΩ and 2kΩ resistor ratios. In the testing code, you can change and modify the code as per your resistor ratio for the voltage divider circuit.
The divider circuit is configured as depicted in the circuit diagram provided. The sensor’s power can be supplied using a 5V external adapter or the 5V/Vin pin if USB is being used. The ground is connected to the sensor’s ground, and the midpoint of the voltage divider connects to any ADC-capable I/O pin on the board (the same pin must be configured in the code—here, pin 4 is used).
Code for Real-Time Current and Frequency Measurement
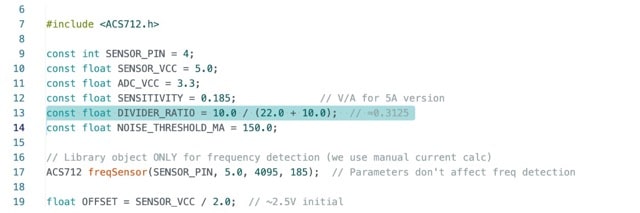
Two codes have been created: one for the Arduino, where sensor data is processed, frequency and current are calculated, and the results are sent to the serial port.
The other is a web app that connects to the serial port using the Web Serial API, displays the data, plots it in real-time, and performs real-time data logging.
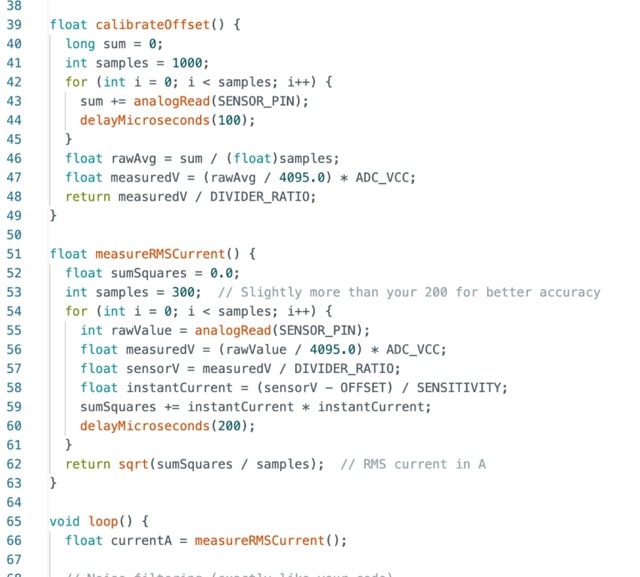
The Arduino code for the IndusBoard Coin allows you to configure the resistor ratio, sensitivity, calibration, and ADC pin. It includes a calibration function that automatically calibrates the sensor at startup for the baseline signal from the sensor under no-load conditions.
Next, a function calculates the AC current in mA and A, based on sensor readings and sends it to the serial port. You can modify the code for other calibrations or manual calibration to enhance the sensor’s accuracy.
Webapp Code:
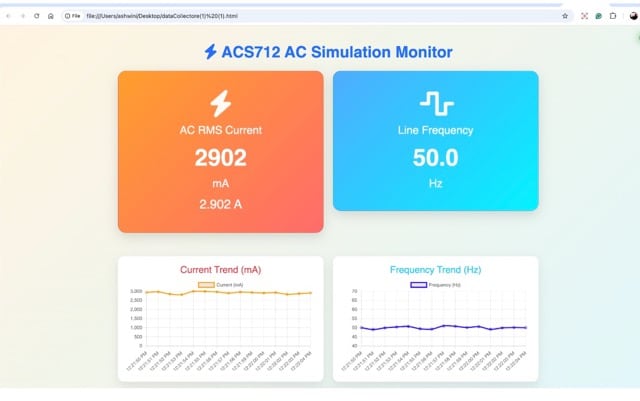
In the web app code, we create two cards: one to display the current data and another for the frequency. Below these cards, there are two graphs for plotting the data over time. At the bottom, we create a Connect/Disconnect button to connect the device and receive data using the Web Serial API. Additionally, there’s another button to display the database table and download the data as a CSV or TXT file on your laptop.

Recommended: Top 13 AI Engineering Projects.
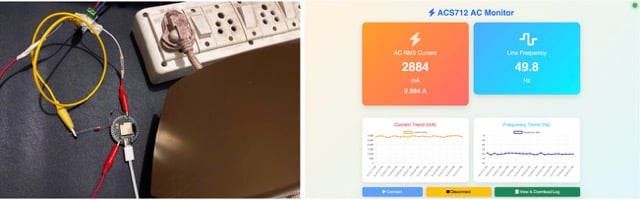
Testing Real-Time Current and Frequency Measurement
Now, after uploading the code, save the web app code as an .html file format. Open that in the Chrome web browser. Now click on the “Connect” button, and it will now display the data. Now plug or tune in the load, you can see the change in the ampere reading and frequency of your power line. Now, click on the database, and it will display the database table and give you the option to download it as a CSV or TXT file.