
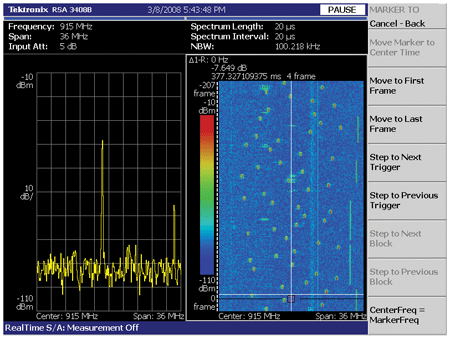

Latest RTSAs can correlate data in frequency, time, symbol and other domains, allowing extensive and quick analysis of complicated RF environments and physical-layer interactions. For ISO18000-6C (EPC GEN2) signals, which automatically change their data rate, these instruments can automatically detect the symbol rate and highlight the preamble, making analysis even easier.
Monitoring RFID co-channel interference
RFID transceivers must comply with local regulations regarding creating interference as well as be designed for optimal immunity to interference. Allocated spectrum, for instance, varies from 2 MHz in Singapore and Europe to 26 MHz in North America. This makes different modulation schemes and collision avoidance techniques favoured in different parts of the world.
Two approaches taken to implement collision avoidance and reduce self-interference are frequency hopping and listen-before-talk (LBT)/synchronisation of RFID readers. Frequency hopping is utilised in the United States according to FCC 47 CFG Ch. 1 Part 15. LBT or synchronisation is implemented in most European countries according to ETSI EN 302 208-1.
[stextbox id=”info”]Latest RTSAs can correlate data in frequency, time, symbol and other domains, allowing extensive and quick analysis of complicated RF environments and physical-layer interactions.[/stextbox]
These signals are bursty by nature in an environment subject to bursty interference from multiple readers, multiple tag responses, and even other RF services such as Wi-Fi, Zigbee, Bluetooth and similar short-range RF communications. Effective analysis of RFID signals in a realistic environment can be a complex task.
One of the best available monitoring techniques is RTSA digital phosphor capability known as DPX. This technique uses a very fast frame rate in combination with indicating signal density, or dwell time, by colour. This allows a unique view of pulsed RF signals in a complex environment.
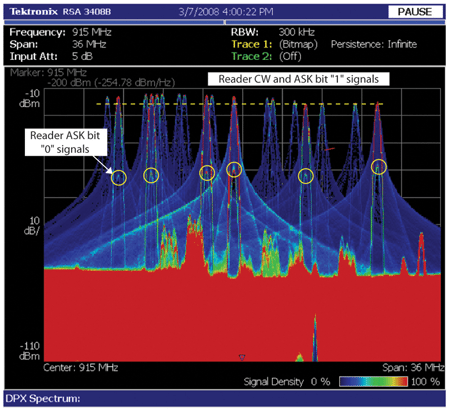
Fig. 6 shows a simulated complex RF environment, created by placing a number of tags within read range of a reader. After only 30 seconds of monitoring the frequency-hopping output of the reader, a lot of information can be seen.
Red signals are always present. In this case, that means the noise floor and several interfering signals towards the bottom of the display. Green signals (mostly bursty interference in this example) are present perhaps 50 per cent of the time, and blue signals are infrequent, as indicated by the signal density scale in the lower right corner.
The blue signals are mostly RFID signals for communications between a reader and the set of tags. In this case, the modulation type is amplitude-shift keying, and the higher narrow blue pulses are 1’s and the lower narrow blue pulses are 0’s. DPX provides visibility of signals that would not be seen on a conventional swept analyser.
In this screen capture, the reader was successful on frequencies without much interference. This is shown first, by seeing that the mostly blue RFID pulses only occur on clear frequencies. Second, by looking at the other colours on the mostly blue RFID pulses, the extended dwell time of a successful RFID transaction can be spotted. It’s realistic to conclude that successful polling occurs at frequencies where no interfering signal is present and the signal-to-noise ratio is greater. This clearly shows that the chances of a successful tag read increase in an environment with minimal interference.
When doing frequency planning to restrict each reader to a certain channel (or channels), DPX can be used to ensure that the modulation sidebands are not at such a level that would cause interference in those channels being used by co-located readers. Note that the reader and tag signals in the centre of Fig. 6 have wide spectral spreading and are dwelling for a longer period of time than in other channels. The brighter signal skirts indicate a higher signal density and thus a longer dwell time. This could be a source of read failures in the adjacent channels, and action should be taken to ensure that filtering in the readers is sufficient to have immunity to this interference.
To sum up
RFID signals, by their nature, may be subject to complex, and even harsh, RF environments. In addition, the pulsed nature of RFID signals makes analysis difficult with conventional spectrum analysers. AWGs and RTSAs make effective simulation and analysis of multiple-reader, dense-mode environments and common interference signals practical. This technique can be used to ensure reliable RFID communications and throughput in harsh conditions.